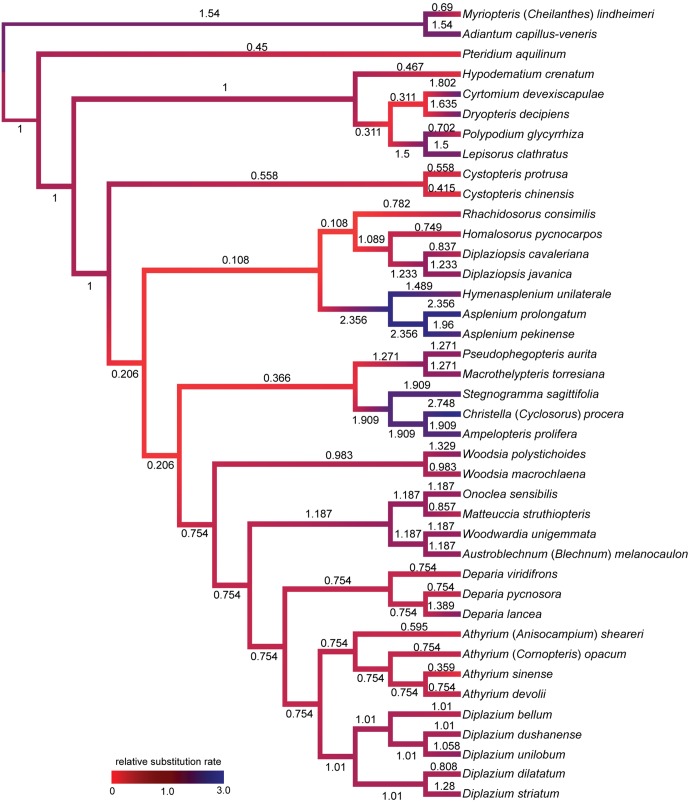
Fig. 3.—
Relative plastid substitution rates among clades/branches of the eupolypod II ferns, based on the “83-gene matrix,” resulting from the random local clock analyses in BEAST v1.8.1. Numbers above the branches indicate relative, median rates with no measured units, scaled by dividing all rates by that of the crown node of eupolypods II. Colors of branches represents to relative rate. Light red indicates a relative rate of 0, whereas a trend of blue color marks a relative rate approaching 3.0.

