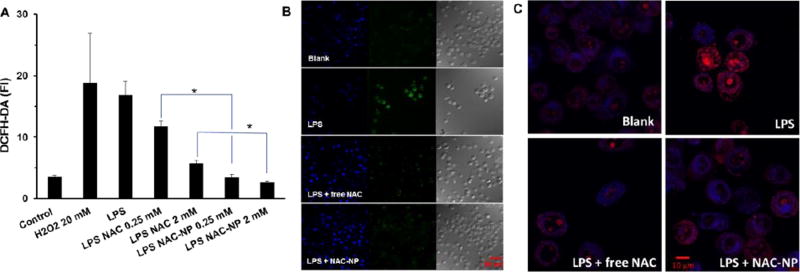
Figure 7.
Effect of NAC and NAC-NPs on the production of ROS by LPS-activated microglia. ROS generation was measured by DCFH-DA fluorescence intensity (A) and visualized by confocal microscopy (B). The nuclei were stained with DAPI (blue) and the ROS was detected by DCFH-DA (green). The production of superoxide was detected by hydroethidine and visualized by confocal microscopy as indicated by the converting blue fluorescent signal to red (C). BV-2 cells were pre-treated with 2 mM free NAC or NAC-NPs in the presence of 100 ng/ml LPS for 3 hours followed by additional 24 hours of LPS (100 ng/ml) treatment. Data expressed as mean ± SD (* P < 0.01).

