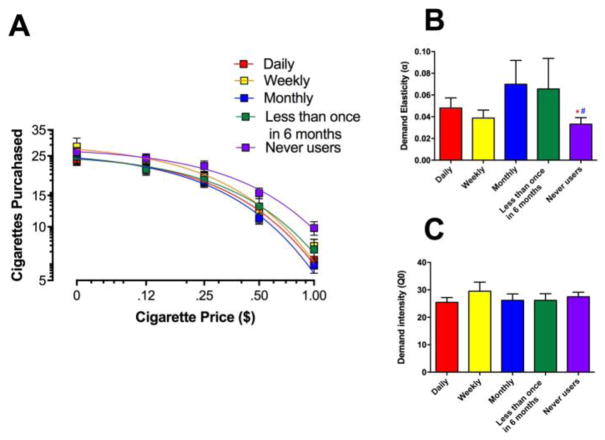
Figure 1.
Cigarette purchases by frequency of e-cigarette use group when cigarettes were available alone. Panel A illustrates the group curve fits. Panel B represents the demand elasticities for individual curve fits for each frequency group. Panel C is the demand intensities derived from individual curve fits in each group. In B and C, bar columns represent group means (SEM). *p<0.5 difference from Daily group. #p<0.05 difference from Monthly group.

