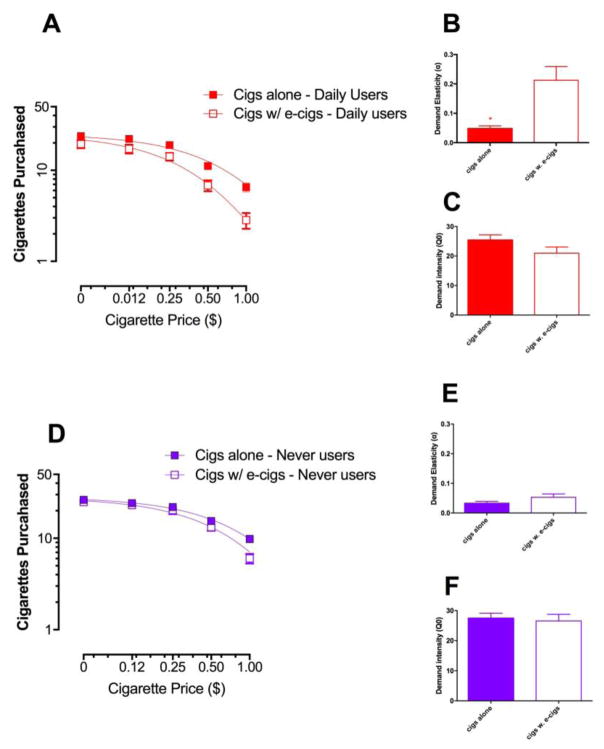
Figure 4.
Cigarette purchases by frequency groups based on the availability of the e-cigarette alternative. Panel A represents the group curve fits of daily e-cigarette users demand for conventional cigarettes during two different market conditions. Panels B and C represent the demand elasticities and intensities derived from individual curve fits for each condition type (i.e., cigarettes alone or cigarettes + e-cigarettes). Panel D represents the group curve fits for the never e-cigarette users for conventional cigarettes during both marketplace conditions. Panels E & F illustrate the elasticities and intensities derived from individual curve fits. *p<0.05.

