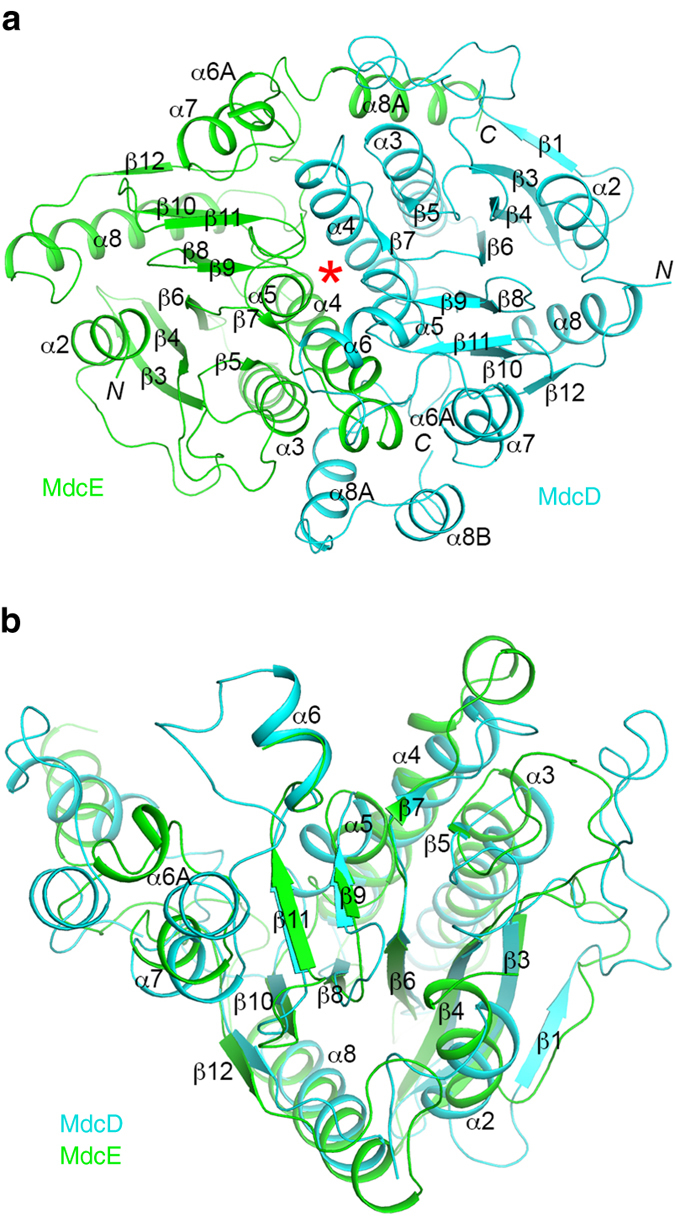
Figure 2.

Structure of the MdcD–MdcE complex. a Schematic drawing of the structure of the P. aeruginosa MdcD–MdcE complex. MdcD is shown in cyan, and MdcE in green. The secondary structure elements are named following the convention of yeast ACC CT domain. The active site is indicated with the red asterisk. b Overlay of the structures of MdcD (cyan) and MdcE (green). The β-strands in the β–β–α superhelix are mostly superposed. All structure figures were produced with the program PyMOL (www.pymol.org)
