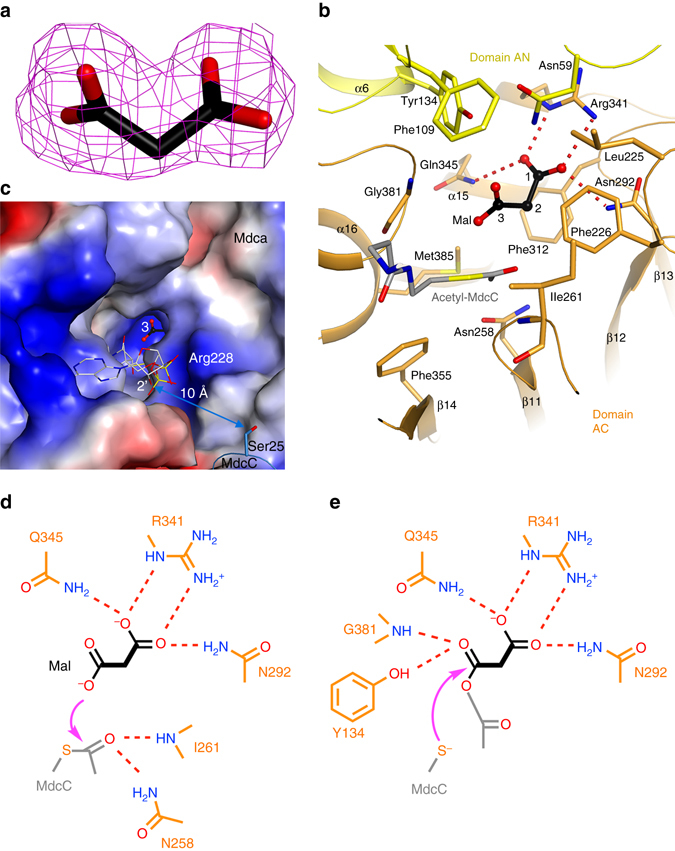
Figure 5.

The active site of MdcA. a Simulated-annealing omit F o−F c electron density map at 2.2 Å resolution for malonate in the active site of MdcA, contoured at 3σ. b Interactions between malonate (black, labeled Mal, with its carbon atoms numbered) and the MdcA active site. Hydrogen-bonding interactions for the C1 carboxylate of malonate are indicated with dashed lines (red). A model for the acetylated prosthetic group of MdcC is shown in gray. c Molecular surface of the active site region of MdcA, colored by electrostatic potential (red: negative, blue: positive). Malonate is located at the bottom of a deep, narrow pocket. A model for the acetylated prosthetic group of MdcC is shown in gray. d Schematic drawing of residues involved in the first step of catalysis by MdcA. The attack of the carboxylate oxygen atom on acetyl-MdcC is indicated by the arrow (magenta), and possible residues stabilizing the oxyanion of the transition state are also shown. e Schematic drawing of residues involved in the second step of catalysis by MdcA. The attack of the thiolate on the anhydride intermediate is indicated by the arrow (magenta)
