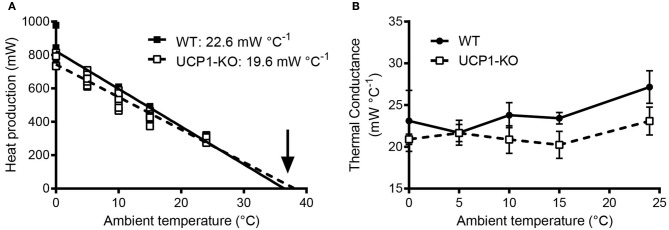
Figure 5.
(A) Assessment of thermal conductance using resting heat production rates collected in wild-type and uncoupling-protein-1 (UCP1-KO)-deficient littermates at different ambient temperatures (“Scholander-Irving plot”; Scholander et al., 1950). Average slopes corresponding to predicted minimal thermal conductance (expressed as positive values) are indicated for each genotype (p = 0.08, t-test). The arrow highlights the x-axis intersection points corresponding to the predicted average body temperature during resting conditions (not different between genotypes; p = 0.44, t-test). (B) Calculated thermal conductance (see Box 6) involving core body temperature readings (E-Mitter Series 3000 XM-FH) in the animals shown in (A). Each point indicates mean ± SD (n = 4–7). Both analyses, (A,B), are supporting lower thermal conductance and thus an altered thermoregulatory strategy involving improved heat conservation in UCP1-KO mice. Data are taken from Meyer et al. (2010).

