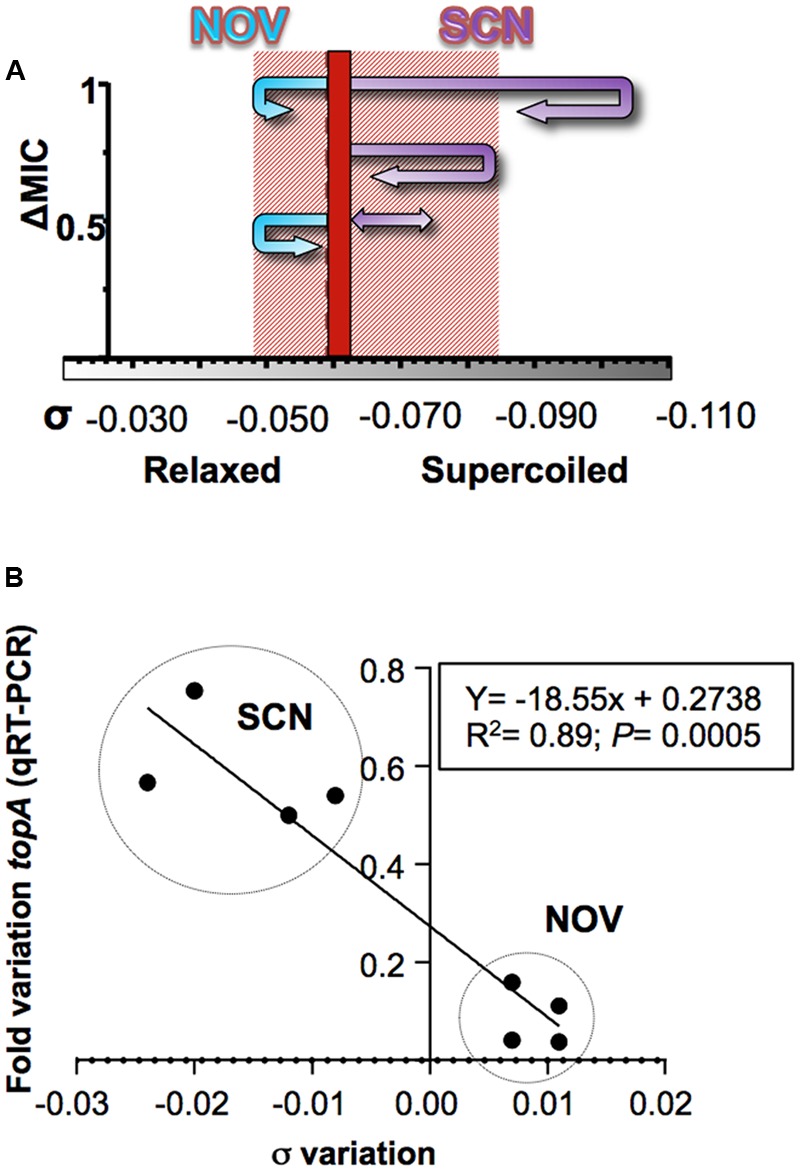
FIGURE 8.

Responses to changes in supercoiling are conducted by Topo I. (A) Diagram showing the trajectory of the supercoiling density at the indicated NOV and SCN concentrations. A dashed line indicates the supercoiling density of DNA of non-treated cells. The shaded area represents the supercoiling density interval in which cells can survive. (B) Correlation between changes in supercoiling level and the transcription of topA. The data correspond to samples treated with either SCN or NOV at concentrations that allowed cell growth and the recovery of DNA supercoiling. Taken from Ferrándiz et al. (2016a), with modifications.
