
FIGURE 3.
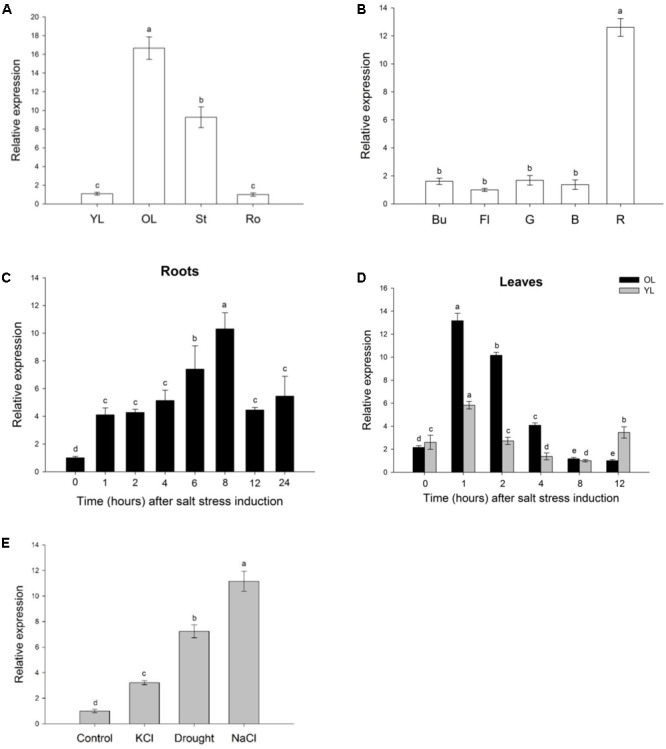
Analysis of SlWRKY3 expression profile. QRT-PCR analysis of SlWRKY3 spatio-temporal expression profile during tomato plant development, in vegetative organs (A) and reproductive organs (B). QRT-PCR analysis of SlWRKY3 expression pattern in response to salinity (150 mM NaCl) in (C) roots or (D) leaves (young leaves (YL) and old leaves (OL), separately). SlWRKY3 weakest relative expression (value is 1) occurs at 8 h for YL and 12 h for OL. (E) Expression of SlWRKY3 in tomato roots exposed to 150 mM NaCl, 150 mM KCl or drought. Actin and GAPDH were used as internal controls. Data represent means and SDs of three technical replicates (n = 4 plants). Different letters indicate significant differences between treatments according to the Student-Newman-Keuls test at P < 0.05. Ro, roots; St, stem; Bu, bud; Fl, flower; G, green stage; B, breaker stage; R, red stage of tomato fruit development.