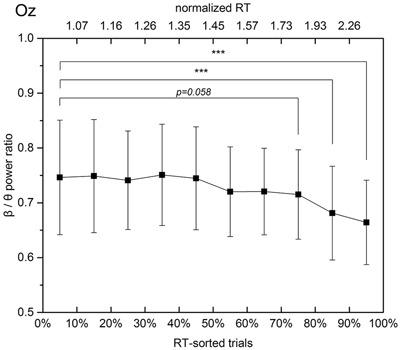
FIGURE 7.

Beta to theta band power ratio at the Oz channel in experimental trials sorted according to the respective normalized RTs. The solid line linearly interpolates 10 mean values, which are calculated with a step of 10% of trials. The error bars show the standard deviations in the subgroups separated by the deciles. When the response time exceeds 1.3 times the mean alert state response time, the mean beta to theta power ratio decreases monotonically and steadily from 0.75 (30–40% subgroup, average normalized RT equals 1.3) to 0.66 (90–100% subgroup, average normalized RT equals 2.7).
