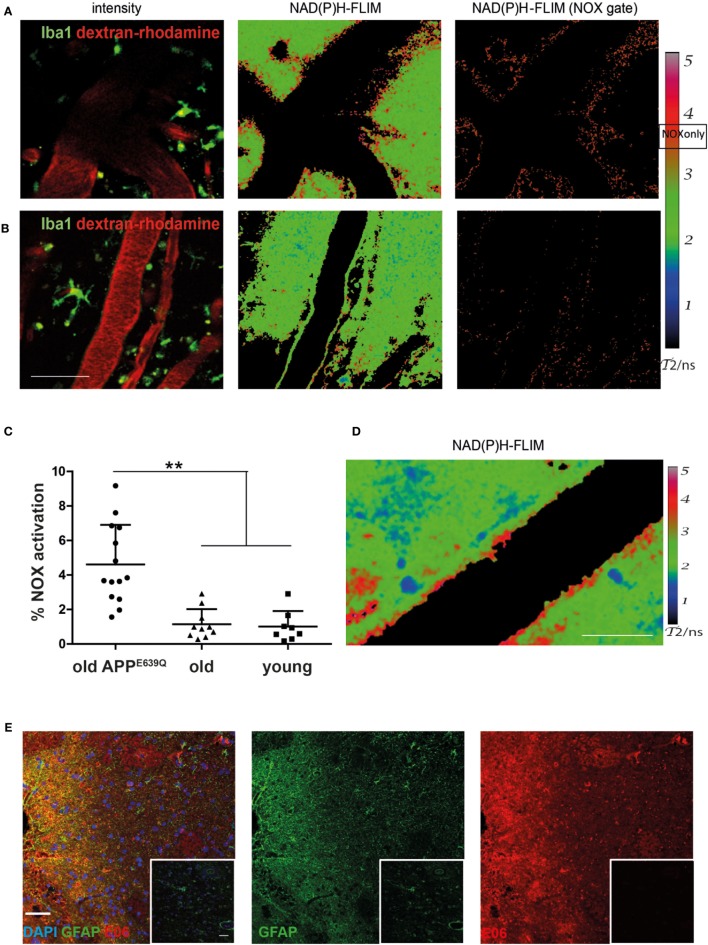
Figure 2.
Elevated NOX activity in the cortex of aged APPE693Q mice. Representative images of areas with elevated (A) and low (B) NOX enzymes activation are both found in old APPE693Q mice with established cerebral amyloid angiopathy (CAA). PMT-based detection of fluorescence signals [left column (A,B) dextran–rhodamine in red and iba1+ cells in green] in a 24-month-old APPE693Q mouse. Scale bar: 50 µm. The corresponding τ2-maps of the middle column show the false color-encoded fluorescence lifetime τ of enzyme-bound NAD(P)H at each recorded pixel of the image. NAD(P)H bound to metabolic enzymes are depicted in blue and green (τ2 between 1 and 3 ns), whereas nicotinamide adenine dinucleotide phosphate (NADPH) bound to activated NOX appears in red (τ2 between 3.3 and 3.9 ns, “NOX only” gate) is displayed in the right column of (A,B). (C) Quantification of the NOX activation area within, i.e., ratio of the area of NOX only gate to the total tissue area, 4.9 ± 2.0% (n = 14 fields of view of 5 mice with 2–4 fields of view per mouse) in APPE693Q mice compared to 1.1 ± 0.7% (n = 10 fields of view of 4 mice with 1–4 fields of view per mouse) and 1.0 ± 0.9% (n = 8 fields of view of 3 mice with 2–3 fields of view per mouse) in healthy controls (old and young, respectively). At least 3 mice per group and 2–4 imaging fields per mouse were analyzed. For statistic evaluation, we applied the ANOVA test (**p < 0.01). (D) The τ2 NAD(P)H-fluorescence lifetime imaging (FLIM) map shows a specific bilayered pattern in the proximity of the vasculature of APPE693Q mice. Scale bar: 25 µm. (E) Representative immunofluorescence image within the cortex of patients with CAA showing strong reactivity with the E06 antibody recognizing oxidized phospholipids in areas with astrogliosis (stained with anti-GFAP antibody) Scale bar: 50 µm, compared to normal appearing tissue from patients with CAA (shown in insets). Scale bar: 50 µm.

