Figure 4.
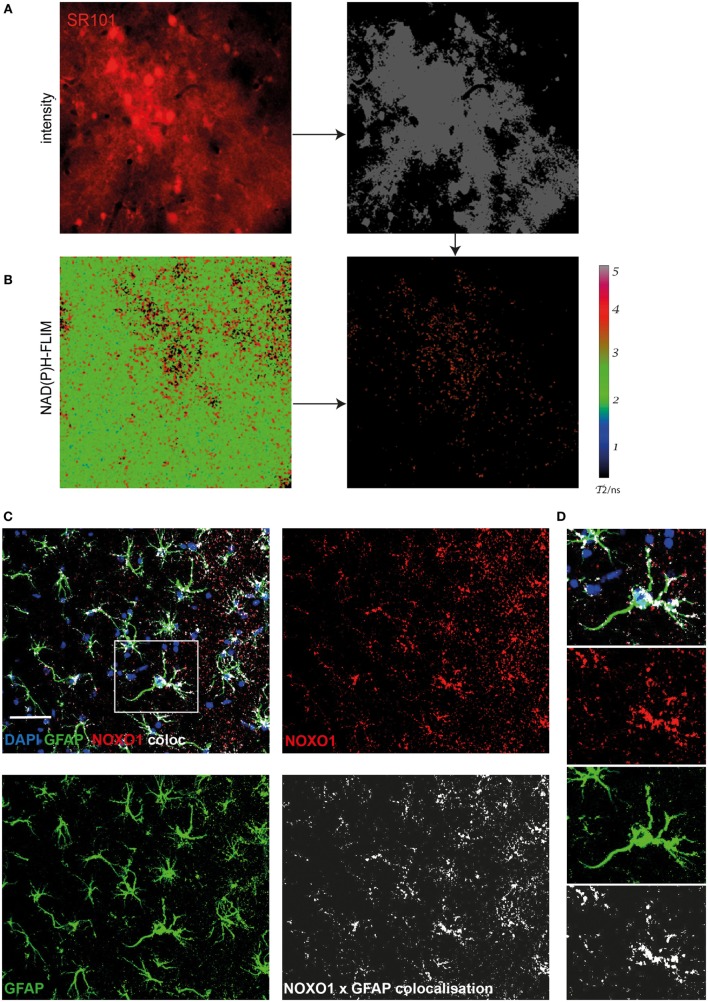
Astrocytes are major cellular sources of activated NOX in APPE693Q mice. Similar to Figure 3, fluorescence intensity images of the cortex of a APPE693Q mice labeled with sulforhodamine 101 (SR101) (A) and corresponding τ2 NAD(P)H-fluorescence lifetime imaging (FLIM) maps of the whole tissue area (B) were correlatively analyzed to measure the contribution of SR101+ cells (mainly astrocytes) to the NOX activation signal. We performed an overlay of the two images and analyzed the NAD(P)H-FLIM signal at the areas of SR101 signal (red). The τ2 NAD(P)H-FLIM images depict the normalized area of NOX activation in relation to the total cellular area in the SR101 labeled cell subsets: mean 37.9 ± 2.1% out of 2 mice; with 2–3 fields of view per mouse. Scale bar: 50 µm. (C) Representative immunofluorescence image within the cortex of a 20-month-old APPE693Q mouse indicating the distribution of Noxo1 (subunit of NOX1, red) and GFAP signal (green). Nuclei are stained with DAPI (blue). Scale bar: 50 µm. White box marks inset displayed in (D).

