
Figure 3.
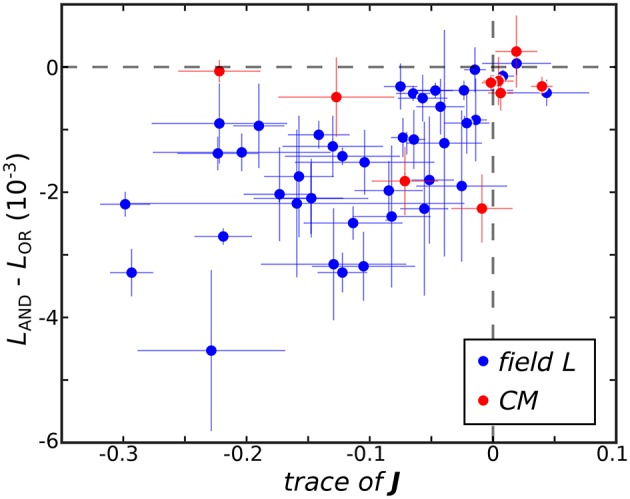
The difference between the negative log-likelihood of the best logical AND (LAND) and logical OR (LOR) models averaged across test sets is plotted against Tr(J) where here J is averaged across jackknives. The horizontal dashed line demarcates neurons best fit by logical OR models on top from neurons best fit by logical AND models below. The vertical dashed line separates neurons where the eigenvalue spectra of mean J are dominated by negative variance on the left and positive variance on the right.