Figure 2.

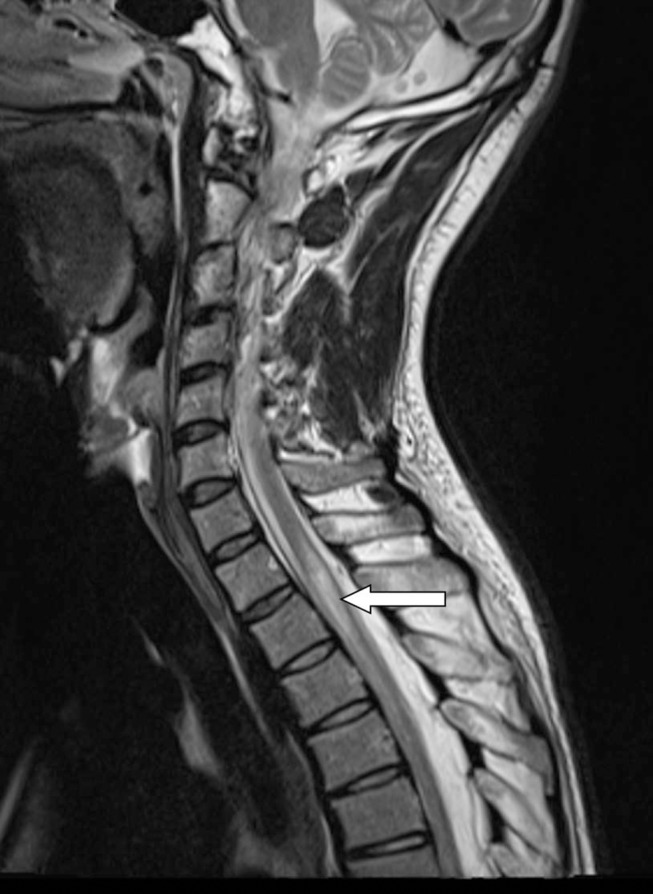
Sagittal T2-weighted images months after admission shows considerable regression of intramedullary oedema with some residual T2 signal abnormality at T1–T2 level (arrow).

Sagittal T2-weighted images months after admission shows considerable regression of intramedullary oedema with some residual T2 signal abnormality at T1–T2 level (arrow).