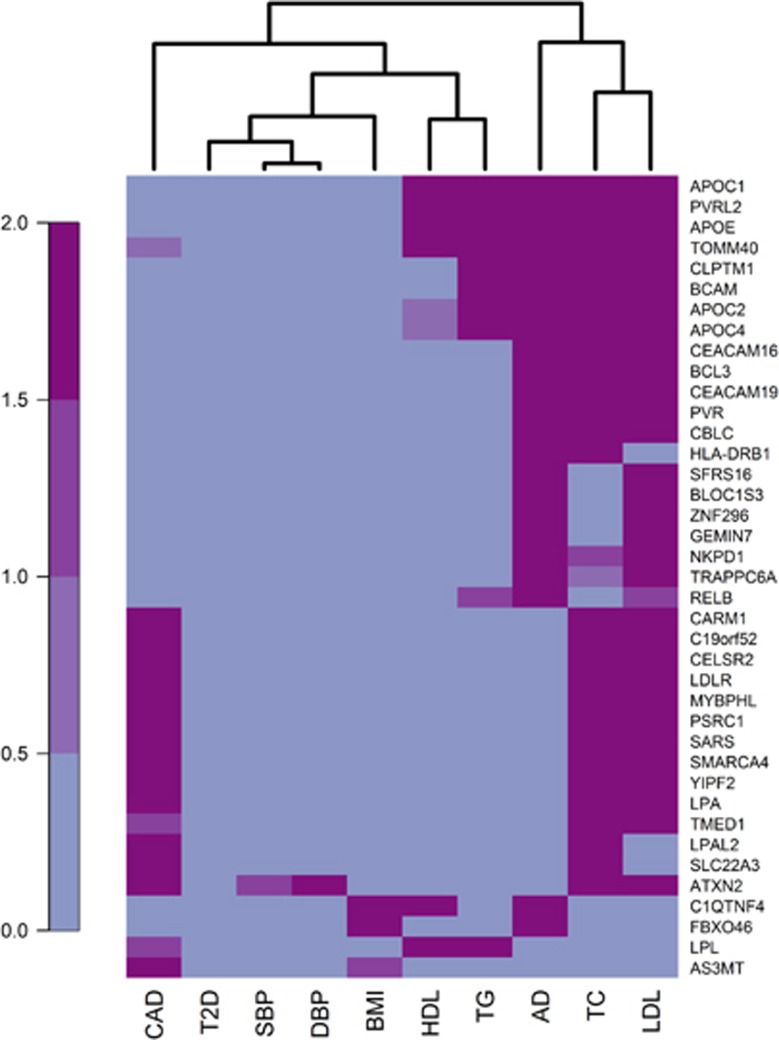
Figure 1.
Heat map of significance of genes associated with AD or CAD across phenotypes. Each row represents one gene, and each column one phenotype. A total of 17 581 genes were available for all outcomes. Out of these, 39 genes were of significance for AD or CAD and at least one additional phenotype at the 2.84 × 10⁻⁶ level, and are hence included in the heat map. The P-values have been Bonferroni corrected for multiple testing and −log10 transformed. Blue color indicates no/low significance while purple indicates high significance. AD, Alzheimer's disease; BMI, body mass index; CAD, coronary artery disease; DBP, diastolic blood pressure; HDL, high-density lipoprotein; LDL, low-density lipoprotein; SBP, systolic blood pressure; T2D, type 2 diabetes.

