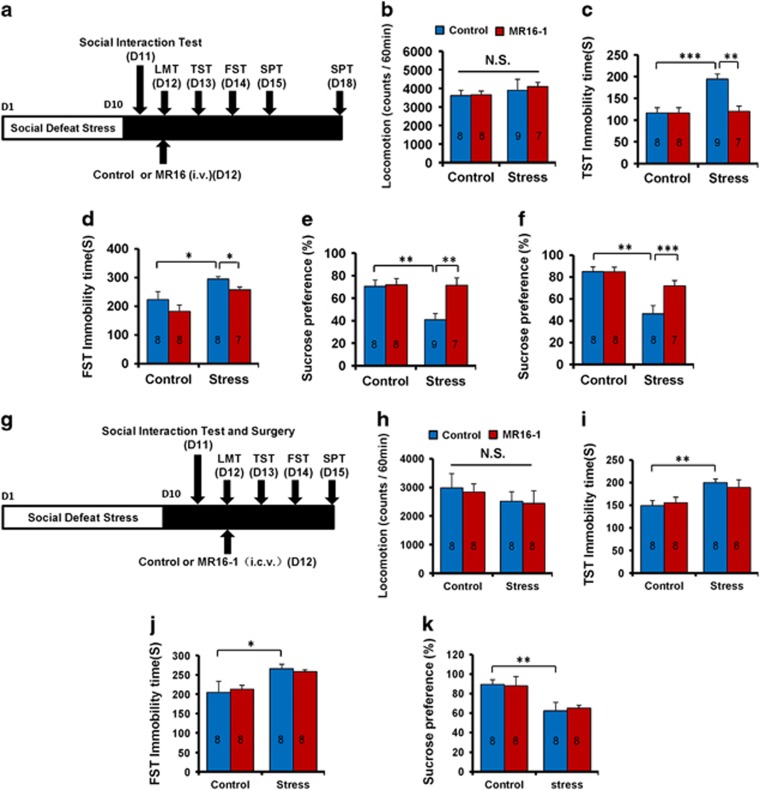
Figure 1.
Antidepressant effects of MR16-1 in social defeat stress model. (a) Schedule of social defeat stress (10 days), social interaction test, drug treatment (intravenous (i.v.)), and behavioral tests. (b) Locomotion test (LMT). (c) Tail suspension test (TST). (d) Forced swimming test (FST). (e) One % sucrose preference test (SPT). (f) One % SPT. Two-way analysis of variance (ANOVA) revealed the results (LMT (b), Stress: F1,31=0.843, P=0.366; MR16-1: F1,31=0.064, P=0.801; interaction: F1,31=0.078, P=0.782), (TST (c), Stress: F1,31=11.351, P=0.002; MR16-1: F1,31=9.425, P=0.005; interaction: F1,31=9.317, P=0.005), (FST (d); Stress: F1,30=15.389, P=0.001; MR16-1: F1,30=4.363, P=0.046; interaction: F1,27=0.008, P=0.929), (SPT (e); Stress: F1,31=6.312, P=0.018; MR16-1: F1,31=7.259, P=0.012; interaction: F1,31=6.002, P=0.021), (SPT (f); Stress: F1,30=5.126, P=0.032; MR16-1: F1,30=5.086, P=0.032; interaction: F1,30=20.956, P<0.001). The values represent the mean±s.e.m. (n=7–9). *P<0.05, **P<0.01, ***P<0.001 compared with the control-treated stress group. (g) Schedule of social defeat stress (10 days), social interaction test and surgery, drug treatment (intracerebroventricular (i.c.v.)), and behavioral tests. (h) LMT. (i) TST. (j) FST. (k) One % SPT. Two-way ANOVA revealed the results (LMT (h), Stress: F1,32=1.406, P=0.245; MR16-1: F1,32=0.091, P=0.765; interaction: F1,32=0.009, P=0.926), (TST (i), Stress: F1,31=12.465, P=0.001; MR16-1: F1,31=0.014, P=0.905; interaction: F1,31=0.391, P=0.537), (FST (j); Stress: F1,31=12.149, P=0.002; MR16-1: F1,31=0.027, P=0.871; interaction: F1,31=0.476, P=0.496), (SPT (k), Stress: F1,31=12.737, P=0.001; MR16-1: F1,31=0.008, P=0.929; interaction: F1,31=0.094, P=0.762). The values represent the mean±s.e.m. (n=8). *P<0.05 and **P<0.01 compared with the control+stressed group. The number in the column is the number of mice. NS, not significant.

