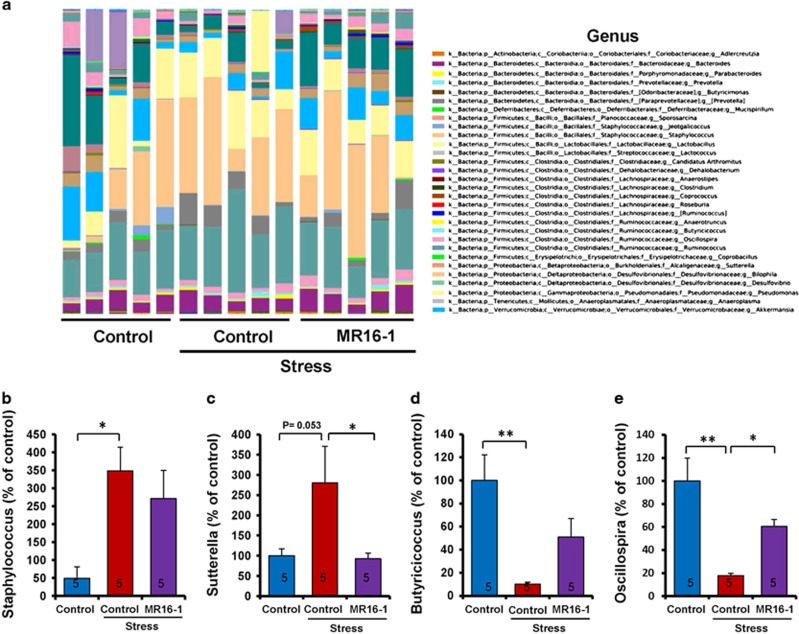
Figure 5.
Effects of MR16-1 on alterations in the composition of gut microbiome in genus of susceptible mice after social defeat stress. (a) Genus. (b) Levels of Staphylococcus. (c) Levels of Sutterella. (d) Levels of Butyricicoccus. (e) Levels of Oscillospira. One-way analysis of variance (ANOVA) revealed the results (Staphylococcus (b), F1,14=4.104, P=0.044), (Sutterella (c), F1,14=4.505, P=0.037), (Butyricicoccus (d), F1,14=6.727, P=0.011), (Oscillospira (e), F1,14=9.762, P=0.003). Data are shown as the mean±s.e.m. (n=5). *P<0.05 and **P<0.01 compared with the control-treated stress group. The number in the column is the number of mice. NS, not significant.

