Figure 2.
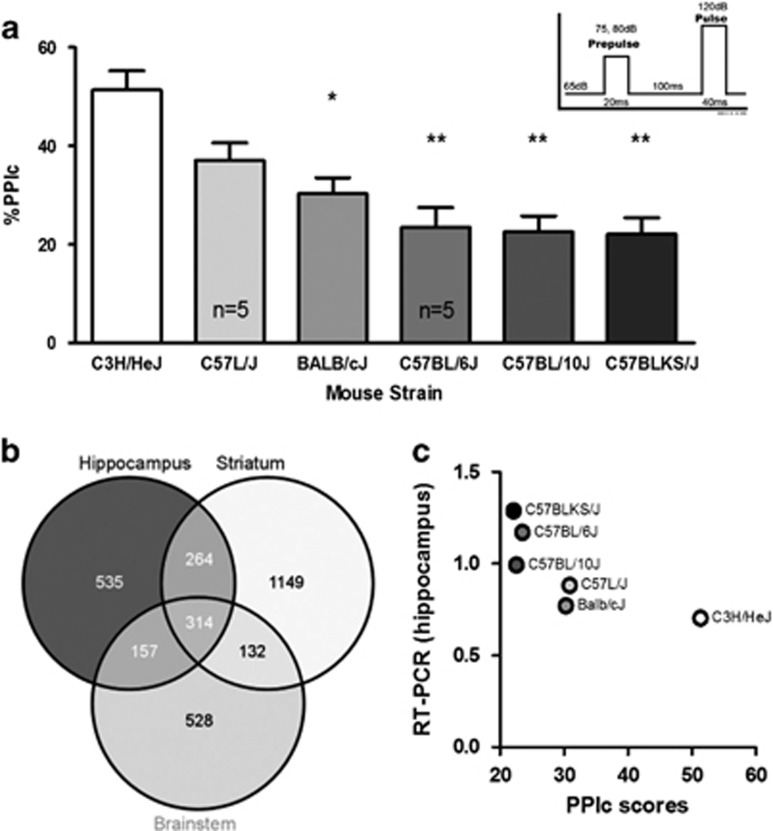
Selection of Pdxdc1 as a candidate transcript for regulating PPI. (a) PPI in six different mouse strains (n=34 mice total). One-way ANOVA for PPIc between all groups showed significant differences (F5,28=10.78, P<0.0001, post hoc with Tukey’s HSD) between C3H/HeJ vs Balb/cJ (*P<0.01), vs C57BL/6J (**P<0.001), vs C57BL/10J (**P<0.001), and vs C57BLKS/J (**P<0.001). PPIc represents the mean PPI for 75 and 80 dB startle intensities. (b) Venn diagram showing overlap between brain regions in transcripts that have levels correlated with PPI. The number of microarray probesets associated with PPI in each region and in common between regions are listed. (c) PPI and Pdxdc1 mRNA levels in the hippocampus are inversely correlated (n=3 mice per strain per tissue; Spearman’s rho −0.8557, P=0.03). Data shown are from real-time RT-PCR for Pdxdc1 mRNA quantification. The strain order for Pdxdc1 mRNA levels mirrors the strain order for PPIs in a. ANOVA, analysis of variance; PPI, prepulse inhibition.

