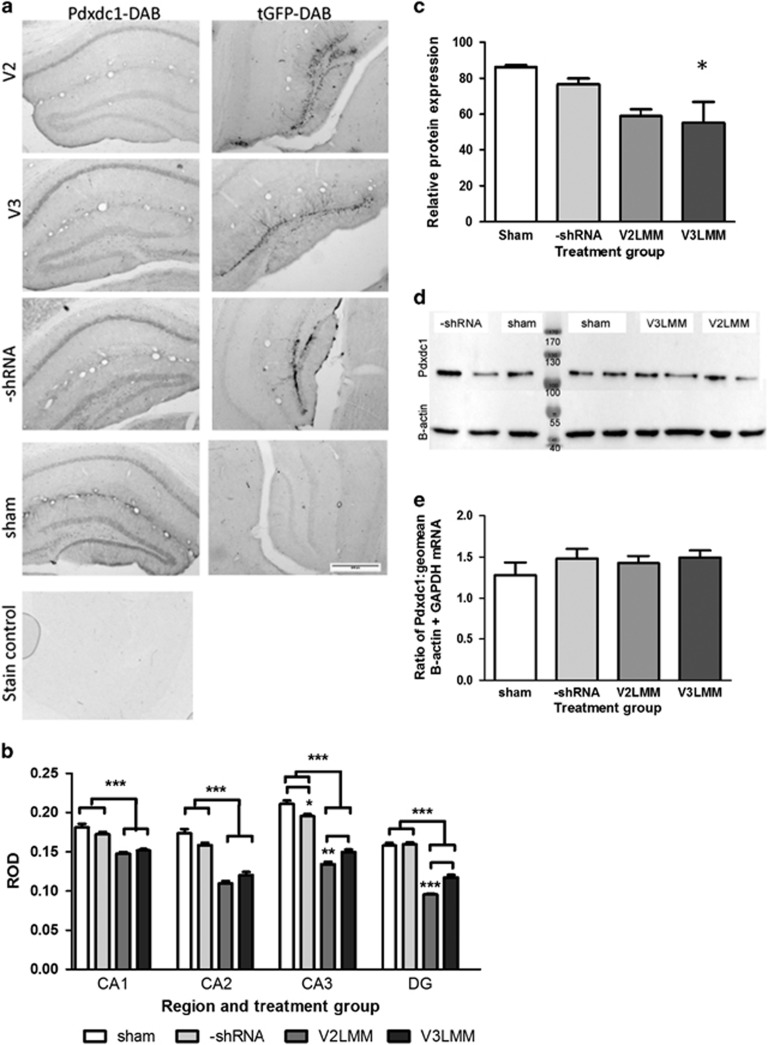
Figure 4.
Knockdown of Pdxdc1 in vivo with lentiviral shRNA. (a) Pdxdc1-DAB (left column): Two viral shRNAs, V2LMM (V2) and V3LMM (V3), were used to knock down Pdxdc1 protein in the dentate gyrus of the hippocampus. tGFP-DAB (right column): the DAB stain for tGFP showing infected areas using V2LMM, V3LMM, or –shRNA viral vectors. Cell bodies and mossy fibers are prominently stained at 4x optical magnification. The scale bar is 400 μm; n=5 mice per shRNA. (b) Significant differences in Pdxdc1 expression as measured by relative optical density (ROD) were seen between anti-Pdxdc1 treated groups and controls (n=5 mice per group). One-way ANOVA for Pdxdc1 quantity was performed within each tissue region for each treatment group with the Tukey HSD post hoc test. CA1 showed a significant difference (ANOVA F3,615=34.50, P<0.0001) with post hoc analysis differences between V2 vs sham, V2 vs –shRNA, V3 vs sham, and V3 vs –shRNA groups (***P<0.0001 each comparison). CA2 had significant differences between groups (ANOVA F3,215=61.75, P<0.0001), and post hoc analysis showed highly significant differences (***P<0.0001, all comparisons listed: V2 vs sham, V2 vs –shRNA, V3 vs sham, and V3 vs –shRNA groups). CA3 groups were significantly different (ANOVA F3,352=109.1, P<0.0001) with post hoc analysis showing differences between V2 vs V3 (**P<0.001), V2 vs sham (***P<0.0001), V2 vs –shRNA (P<0.0001), V3 vs sham (P<0.0001), V3 vs –shRNA (P<0.0001) and between sham vs –shRNA (P<0.05). (c) Pdxdc1 protein levels in dorsal hippocampus normalized to β-actin, showing a significant decrease with the V3LMM shRNA; mean ±s.e.m., *P<0.05. (d) Pdxdc1 protein from dorsal hippocampus shown on representative Western blot; Pdxdc1 (top) and β-actin (bottom) for all treatment groups, 2 lanes for each treatment and 3 lanes sham (n=4–5 mice per treatment group). (e) Pdxdc1 mRNA expression between the four treatment groups, normalized to housekeeping genes. No significant differences were seen between the groups. Data are shown as mean±s.e.m..

