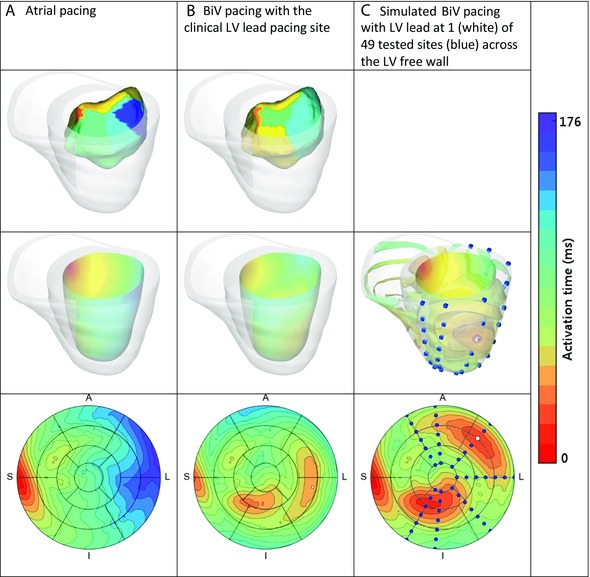
Figure 1.

Top row: Clinical measurements of the LV endocardium electrical activation were taken using an ENSITE balloon catheter for case 2 with (A) atrial pacing and (B) biventricular (BiV) pacing. Middle row: The model parameters were fitted to the electrical activation of the heart with (A) atrial or (B) BiV pacing. (C) The models were then used to simulate the electrical activation of the heart at a range of LV epicardium sites. Bottom row: The simulated activation wave on the LV endocardium was projected onto the 17‐segment AHA map for the different scenarios.
