Figure 2.

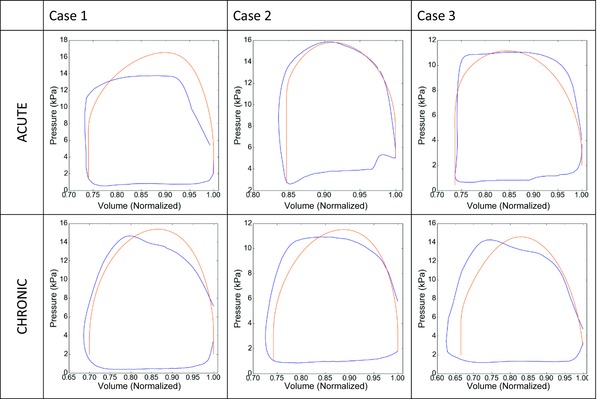
Clinical (blue) and simulated (orange) pressure volume loops for the 3 patient cases before (ACUTE) and after at least 6 months of CRT treatment (CHRONIC).

Clinical (blue) and simulated (orange) pressure volume loops for the 3 patient cases before (ACUTE) and after at least 6 months of CRT treatment (CHRONIC).