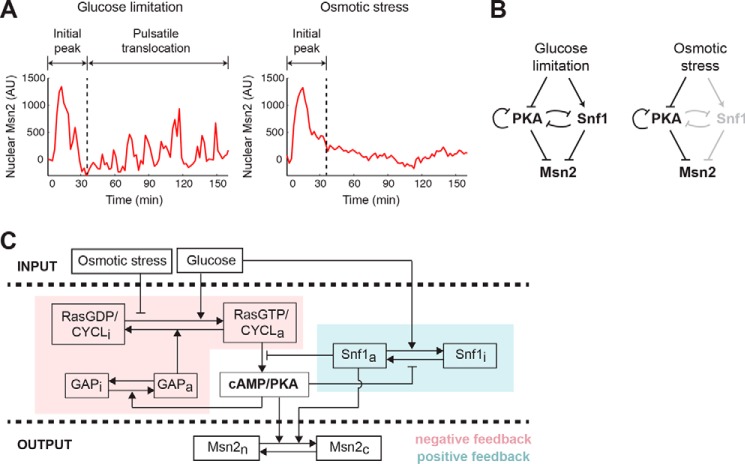
Figure 1.
A computational model for stimulus-dependent Msn2 dynamics. A, illustration of distinct Msn2 dynamics in response to glucose limitation and osmotic stress. Representative single-cell time traces of Msn2 nuclear localization in response to 0.2% glucose (left; glucose limitation) or 1 m sorbitol (right; osmotic stress) are shown. B, diagram of major signaling pathways that govern Msn2 responses. Glucose limitation is mediated by both PKA and Snf1 to drive Msn2 dynamics (left). Osmotic stress is primarily mediated through PKA, so Snf1 is grayed out to illustrate that it is not activated by osmotic stress (right). C, scheme of the computational model. The variables of the model include: RasGDP/CYCLi and RasGDP/CYCLa, the inactive and active fractions of Ras/adenylate cyclase; GAPi and GAPa, the inactive and active fractions of GAP proteins; cAMP/PKA, the level of cAMP/active PKA; Snf1i and Snf1a, the inactive and active fractions of Snf1; and Msn2c and Msn2n, the cytoplasmic and nuclear fractions of Msn2. The glucose level influences the activation of Ras/cyclase and the inactivation of Snf1, whereas the level of osmotic stress represses only the activation of Ras/cyclase. A negative feedback loop through GAP and Ras/cyclase on PKA is highlighted in pink, and a positive feedback loop via Snf1 on PKA is highlighted in blue. AU, arbitrary units.

