Figure 2.
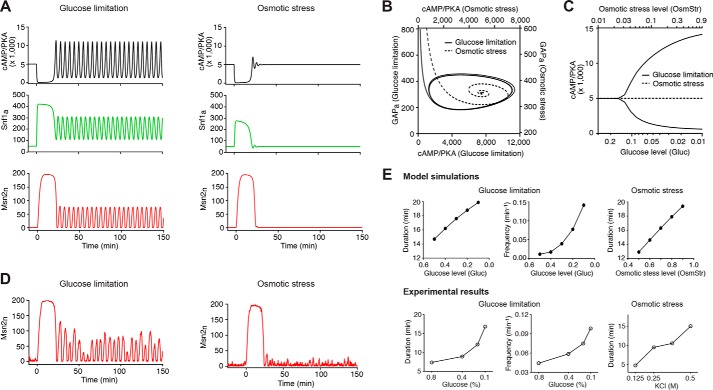
Model simulations of Msn2 dynamics in response to different stresses. A, simulated time traces of active PKA (cAMP/PKA; black), active Snf1 (Snf1a; green), and nuclear Msn2 (Msn2n; red) in response to glucose limitation (left) and osmotic stress (right) from the deterministic model. The unit for the y axis is molecules/cell. For glucose limitation and osmotic stress, we used the dimensionless parameters Gluc and OsmStr to measure the intensity of stresses. Gluc = 1 and OsmStr = 0 are used for the non-stress condition; Gluc = 0.05 and OsmStr = 0 are used to generate the simulated time traces for glucose limitation (left); Gluc = 1 and OsmStr = 0.95 are used to generate the simulated time traces for osmotic stress (right). As described in detail in the supplemental data, the rate of Ras activation is assumed to depend linearly on both glucose and osmotic stress levels in the form of rate ∝ Gluc(1 − OsmStr). The above values of Gluc and OsmStr are selected so that glucose limitation and osmotic stress would have the same effect on Ras activation, and hence any difference in the output can only be attributed to the Snf1-mediated positive feedback. B, phase plane trajectories of cAMP/PKA and active GAP (GAPa) corresponding to the simulated system dynamics in A. The trajectory under glucose limitation is represented by a solid curve (use y axis on the right and x axis on the bottom); the trajectory under osmotic stress is represented by a dashed curve (use y axis on the left and x axis on the top). C, bifurcation diagram showing the maximum and minimum values of cAMP/PKA in the asymptotic regime (t → ∞) as a function of the intensity of glucose limitation (solid curves; use x axis on the bottom) or osmotic stress (dashed line; use x axis on the top). D, simulated time traces of nuclear Msn2 from the stochastic model. The values of Gluc and OsmStr are identical to those used in A to simulate glucose limitation and osmotic stress. E, dependence of Msn2 dynamics on stress intensity. Top panels are model simulations. The durations of the initial peaks for both glucose limitation (leftmost) and osmotic stress (rightmost) were quantified from deterministic simulations, and the pulse frequencies under glucose limitation (middle) were calculated from stochastic simulations by setting a threshold for pulse identification (see supplemental data for details). Bottom panels are experimental results. The plots were generated using single-cell data from Ref. 8.

