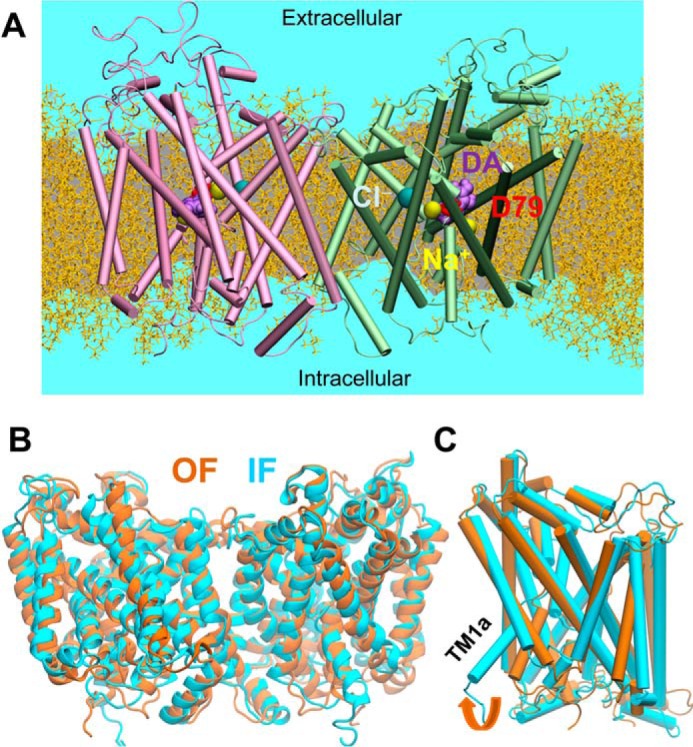
Figure 3.

MD simulations of hDAT dimer dynamics, embedded into membrane lipids. A, typical MD set-up for hDAT dimer (colored in pink and green) in a lipid bilayer (yellow licorice format (55)) and solvated by 0.15 m NaCl (light blue). The bound substrate DA and the co-transported Na+ and Cl− are represented by purple, yellow, and cyan spheres. B, alignment of 100-ns MD equilibrated hDAT dimer in the outward-facing (OF; orange ribbon diagram) and inward-facing (IF; cyan) state. The r.m.s.d. between the OF and IF dimers levels off at 3.4 ± 0.3 Å. C, comparison of helical orientations in the OF and IF states. For clarity, one monomer (in schematic format) taken from the dimer is shown for each state.
