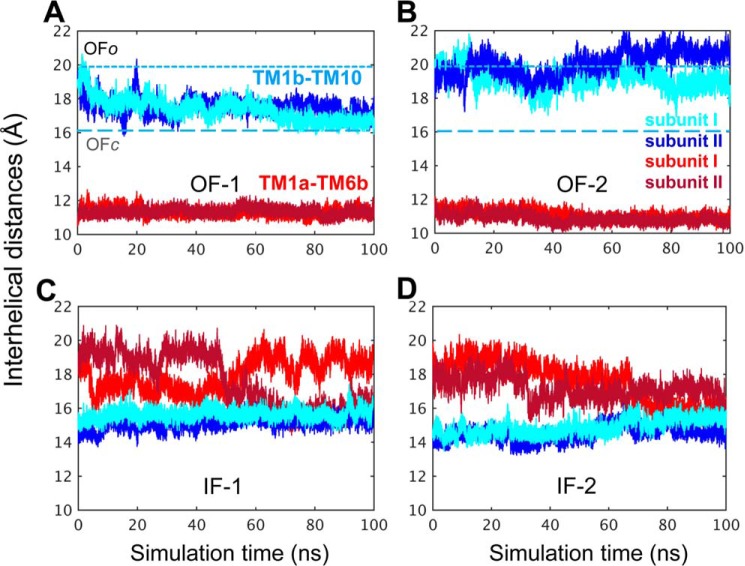
Figure 4.
Time evolution of the interhelical distances. The opening/closure of the EC and IC vestibules is characterized by the respective interhelical distances of the EC-exposed TM1b-TM10 and the IC-exposed TM1a-TM6b, shown for both subunits, as labeled (see Refs. 26 and 27). Results from four runs are presented: A, OF-1, in which the closure of the EC vestibule led to the OFc state in both subunits. B, OF-2, in which both subunits remained in the OFo state, as indicated by the separation between the EC-exposed TM1b and TM10 segments (light and dark blue) and the close proximity of the IC-exposed helical segments TM1a-TM6b (light and dark red). C, IF-1, in which the IC vestibule remained open in both subunits (see the red curves). D, IF-2, in which the initiation of a transition to the OF conformation could be observed, but the IC vestibule remained open in both subunits. The characteristic distances for TM1b-TM10 obtained in the hDAT dimer simulations are 20.0 ± 2.0 Å and 16.5 ± 0.5 Å in the OFo and OFc states, respectively. These values closely approximate those reported for hDAT monomer simulations (27). Distances are indicated by dotted and dashed lines in panels A and B. In the OF state the distance between the IC-exposed segments TM1a and TM6b remained 11.5 ± 1.0 Å, the same as that reported in the monomer simulations (27). In the IFo state, the IC vestibule is open for DA release when the distance between TM1a and TM6b is >15 Å in hDAT monomer (see Cheng and Bahar (27)).

