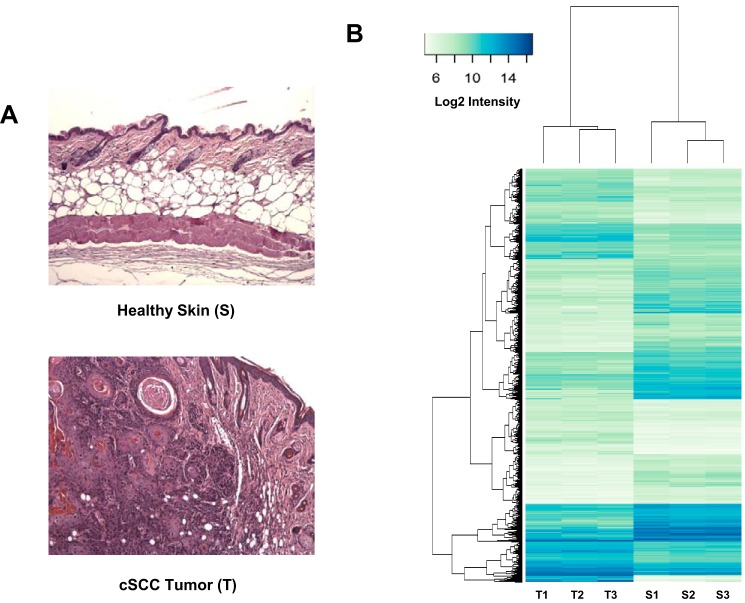
Figure 1.
Gene expression analysis of biopsies of healthy skin and cSCC tumor samples. A, example of tissue sections of healthy mouse skin (S) and DMBA/TPA-induced cSCC tumors (T) used for the transcriptomic analysis. Pictures correspond to hematoxylin/eosin-counterstained formalin-fixed paraffin-embedded sections. B, RNAs extracted from three individual samples of healthy skin treated with acetone only (S1–S3) and three DMBA/TPA-generated cSCC tumors (T1–T3) (see A) were labeled with Cy3 and hybridized with mouse gene expression 8 × 60,000 v1 microarrays from Agilent as described under “Experimental procedures.” The graph shows the heat map comparing the normalized log2 of gene intensity signal in the different conditions. The following threshold values were used to define the set of up- and down-regulated genes: average expression >7.0, absolute log FC >1.0, adjusted p value <0.05.

