Figure 2.
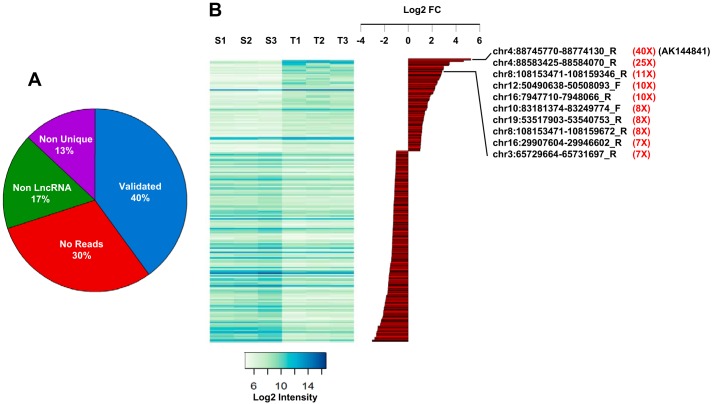
lncRNA expression in healthy skin (S1–S3) and in DMBA/TPA-generated cSCC tumors (T1–T3). A, pie chart summarizing the validation analysis of the lncRNA probes spotted on the Agilent SurePrint microarray (see “Results”). Among the 507 probes up- and down-regulated between healthy skin and tumors, only 202 (40%) have been validated. When considering the 305 transcripts that were excluded, 30% (211) were indeed not detected by RNAseq at a cutoff above four reads, 17.4% (53) showed complementarity with multiple chromosomal regions, and 13.4% (41) were located in exons of protein-coding genes. B, heat map (left) representing the expression intensity of the 202 validated probes in the three samples of normal skin (S1–S3) and tumors (T1–T3). Histograms represent the log2(T/S ratio) (log2 FC) of the validated probes, highlighting the top 10 lncRNAs significantly up-regulated in tumors and the amplitude of their overexpression in tumors (in red). Note that AK144841 is the most up-regulated gene.

