Figure 7.
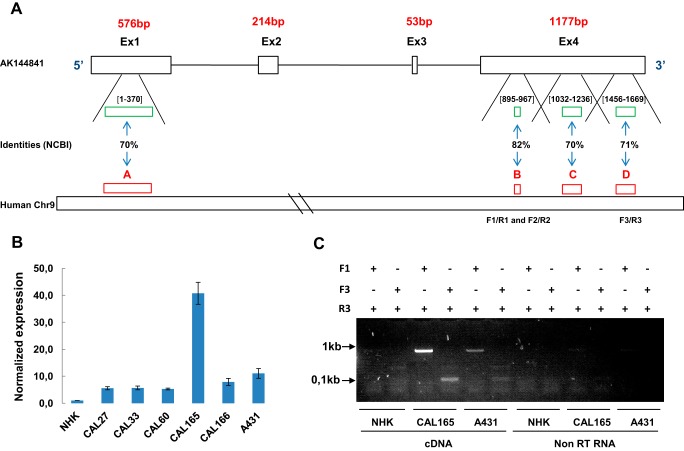
Identification of hAK144841. A, representation of the four regions on human chromosome 9 (A, B, C, and D) showing identities >70% with mouse AK144841. A, Chr9:21788348–21788715; B, Chr9:21754756–21754828; C, Chr9:21754518–21754740; D, Chr9:21753686–21753902. The green boxes and the numbers between brackets schematize the position of these identities on Exon 1 and Exon 4 of AK144841. B, research and quantification of a putative hAK144841 transcript in different SCC cell lines by qPCR. Experiments were performed using oligo(dT)-synthesized cDNA of the indicated cells lines and the three different primer sets (F1/R1, F2/R2, and F3/R3) designed in the regions presenting homologies with AK144841 as indicated on the scheme in A. The expression of AK144841 was normalized to its level in NHKs. The graph represents the mean of two different experiments. Error bars represent S.E. of three experiments. C, classical PCR experiments performed using cDNA and non-reverse-transcribed RNAs of CAL165 and A431 cells. Two primers sets, F1/R3 and F3/R3, were used, generating amplicons of about 800 and 100 bp, respectively. Note the absence of amplification when the PCRs were carried out with non-reverse-transcribed (non-RT) RNAs.

