Figure 3.
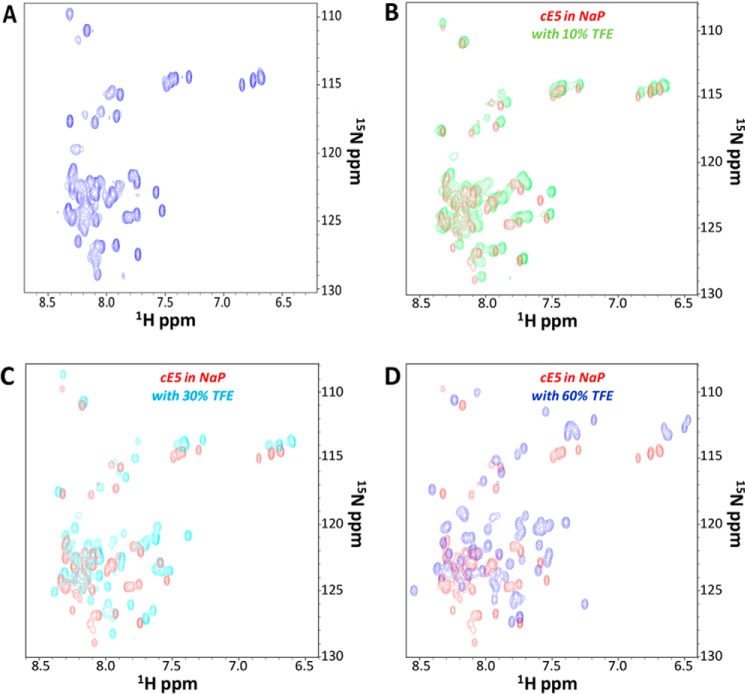
NMR spectroscopy of the A. gambiae cE5 protein. A, 1H,15N HSQC spectrum of uniformly 15N-labeled cE5 (20 μm in 50 mm sodium phosphate, pH 7.8; sample total volume: 550 μl with 10% D2O). B–D, monitoring the effect of TFE on the intrinsically disordered protein cE5. Comparison of HSQC spectra of 15N-labeled cE5 in the absence (red) and in the presence of TFE at increasing concentrations: B, 10% (green); C, 30% (cyan); D, 60% (blue). NaP stands for sodium phosphate buffer.

