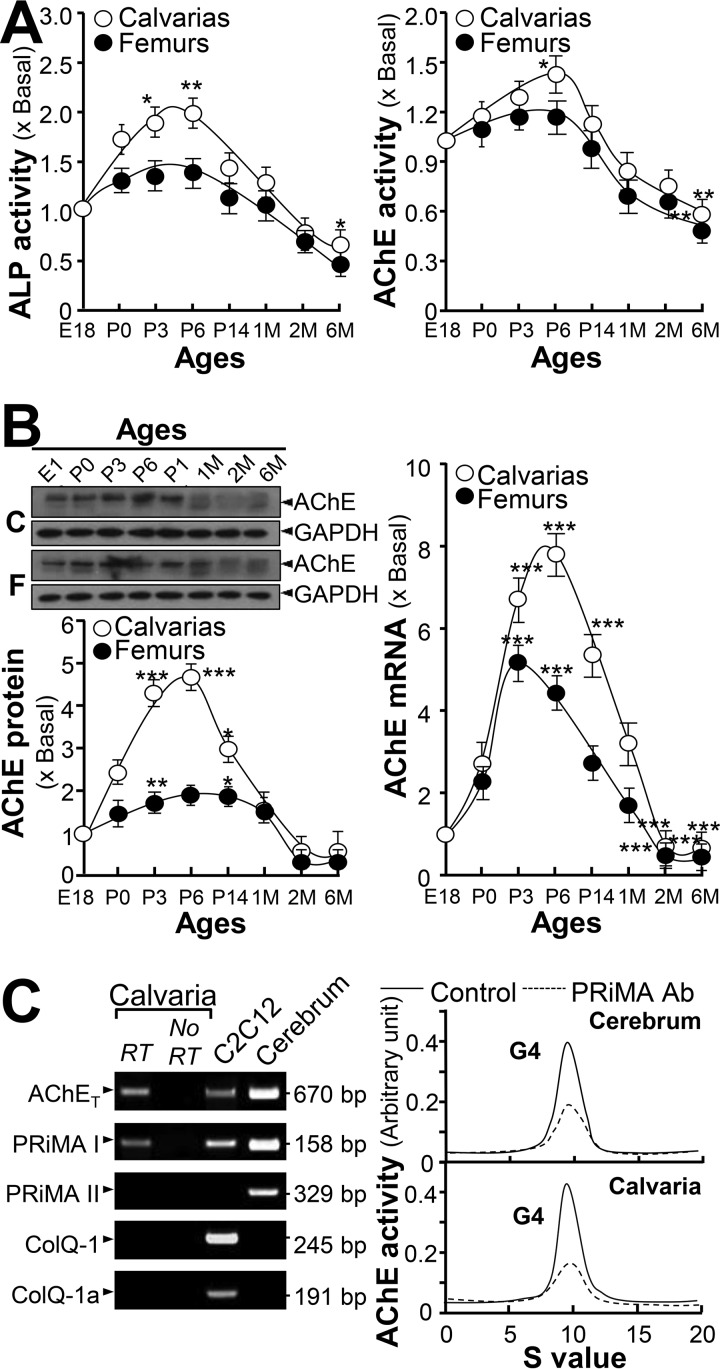
Figure 1.
Increase of AChE expression and activity during bone development. A, calvarias and femurs from rats on different stages as indicated were isolated and assayed for ALP and AChE activities. B, upper panel: protein lysates from bone tissues were analyzed by Western blotting. AChE (∼68 kDa) and GAPDH (∼35 kDa) were shown. Lower panel, quantitation of AChE protein, calibrated from the blots by densitometry. Right panel shows the real-time PCR of AChE mRNA. Values are expressed as fold-increase to basal reading. C, left panel, total RNAs were extracted from calvarias and femurs to perform PCR to determine the presence of AChET, PRiMA I, PRiMA II, ColQ-1, and ColQ-1a by using specific primers. PCR products were resolved on a 1% SYBR safe-stained agarose gel and visualized under the UV light. The identities of PCR product was confirmed by DNA sequencing. Rat cerebrum and mouse C2C12 RNAs served as positive controls. Right panel, molecular forms of AChE in calvarias and femurs were determined by sucrose density gradient analysis. PRiMA-linked G4 AChE was immunodepleted by anti-PRiMA antibody. Cerebrum served as a positive control for G4 AChE. Enzymatic activities are expressed in arbitrary units. Values are in mean ± S.E., n = 4, *, p < 0.05; **, p < 0.01; ***, p < 0.001.

