Figure 5.
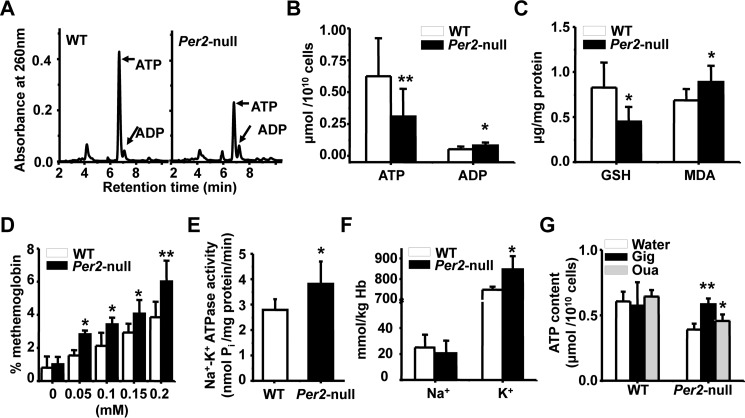
Enhanced Na+/K+-ATPase activities and decline of ATP level in Per2-null erythrocytes. A, HPLC profile of ATP and ADP in red blood cells. B, quantitation of ATP and ADP in RBCs of WT and Per2-null mice. C, analysis the content of GSH and MDA in RBCs of WT and Per2-null mice. D, elevated methemoglobin formation in Per2-null erythrocytes in response to various concentrations of H2O2 treatment. E, Na+/K+-ATPase activities were increased in the erythrocyte membrane of Per2-null mice. F, concentration of Na+ and K+ in the erythrocytes. G, quantitation of ATP in WT and Per2-null RBCs with or without digoxin (Dig) for 30 min and ouabain (Oua) treatment for 6 h. Results represent mean ± S.D. (error bars); n = 5–8 in each group; *, p < 0.05; **, p < 0.01.

