
Figure 2. Increased PD-L1 expression in splenocytes in the two-hit sepsis model.
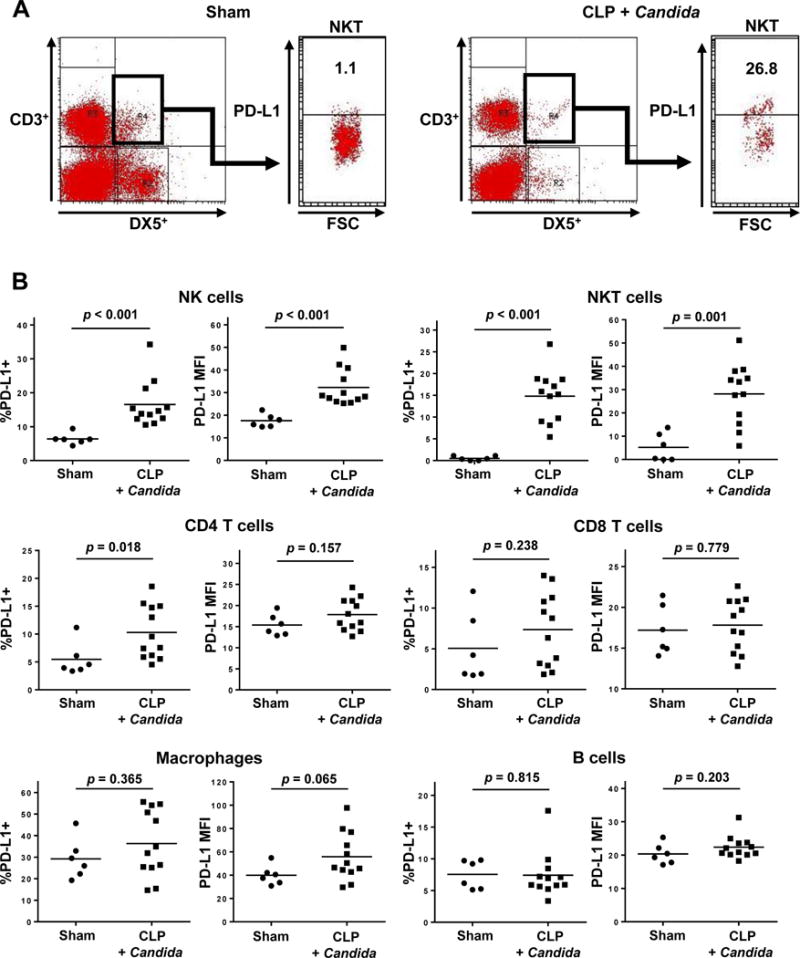
FSC denotes forward scatter of cells examined by flow cytometry; and MFI, mean fluorescent intensity.
Mice underwent sham or CLP surgery (Day 0). Candida albicans was intravenously injected to CLP mice at 3 days post-CLP, and sham-operated mice did not receive Candida infection. PD-1 expression on splenocytes was quantitated via flow cytometry at 7 days post-surgery (4 days after Candida infection). Results of two independent experiments were combined and the total numbers of mice in sham-operated mice and CLP mice with Candida infection were 6 and 12, respectively. T cells and NK cells were gated as indicated in Figure 2. Macrophages were identified as F4/80+; and B cells as B220+. PD-L1+ cells were identified as CD274+.
(A) Representative flow diagrams of NKT cells are shown. The positivity of PD-L1 expression on NKT cells was evaluated.
(B) The percentages of PD-L1+ cells and the MFI in NK, NKT, B, CD4 T, and CD8 T cells, and macrophages are shown.