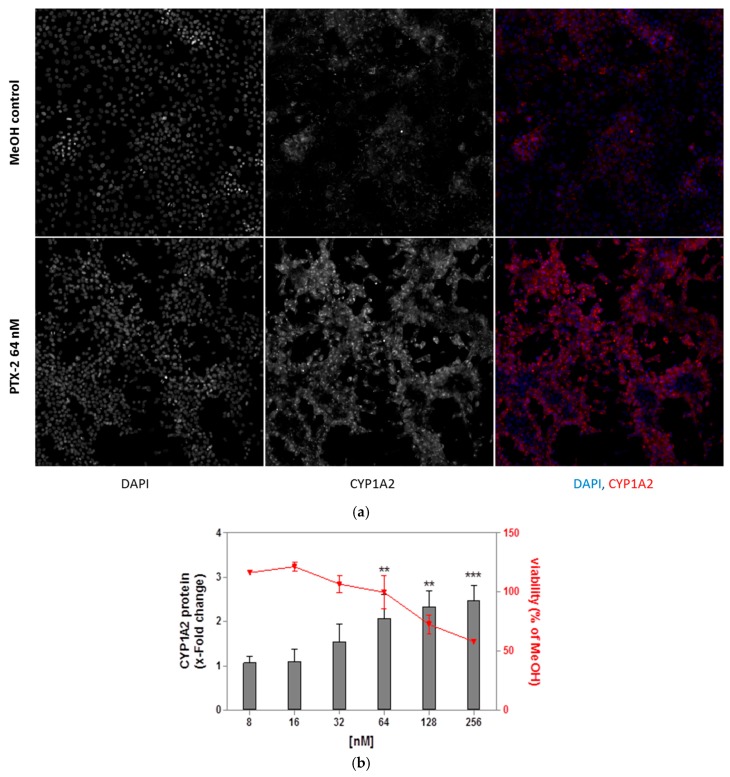
Figure 3.
CYP1A2 protein induction after a 24 h treatment with PTX-2 in HepaRG cells. (a) Representative images at 10× magnification of CYP1A2 induction in HepaRG control cells (2.57% MeOH) and cells treated with 64 nM PTX-2. CYP1A2 was labeled with a specific antibody, and cell nuclei were stained with DAPI. The images were captured with Arrayscan VTi. Blue: nuclei, Red: CYP1A2; (b) CYP1A2 protein induction in HepaRG cells treated with PTX-2 for 24 h. The left Y axis depicts the fold induction of CYP1A2 normalized to solvent control, whereas the right Y axis depicts cell viability. The results were obtained from three independent experiments performed in triplicate (mean ± SD). ** p < 0.01, *** p < 0.001 after one-way ANOVA followed by Dunnett’s post hoc tests.

