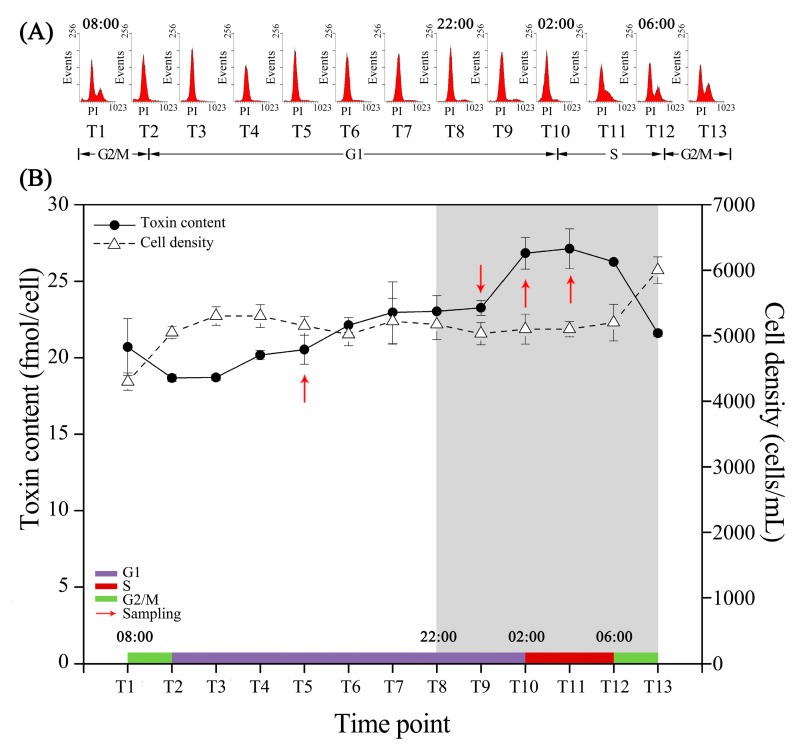
Figure 1.
Cell cycle phase, cell density and intracellular toxin content of ACHK-T. The time interval between each time point is 2 h. (A) Cell cycle phase distribution. The X-axis is the relative amount of DNA and Y-axis is the number of cells in a sample containing a particular amount of DNA. The peak patterns indicate different cell cycle phases. (B) Curves of cell density and intracellular toxin content. The colorized line above the X-axis shows the cell cycle phase distribution obtained in subfigure (A). The grey box corresponds to the dark period and the red arrows represent the time points when samples were collected for RNA-seq. The toxin contents were reported as the mean of biological triplicates with standard deviation. (n = 3, T5-vs-T9: p-value = 0.000; T9-vs-T10: p-value = 0.000; T10-vs-T11: p-value = 0.722; other p-values are shown in Supplementary Files S6).

