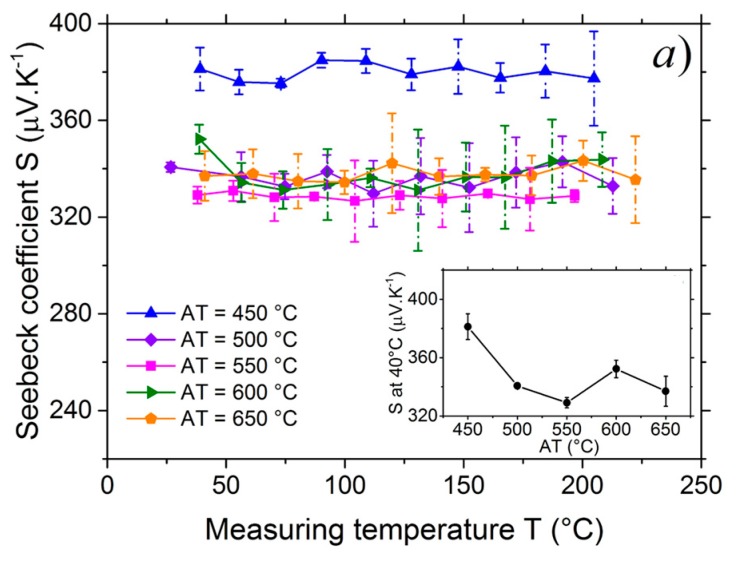
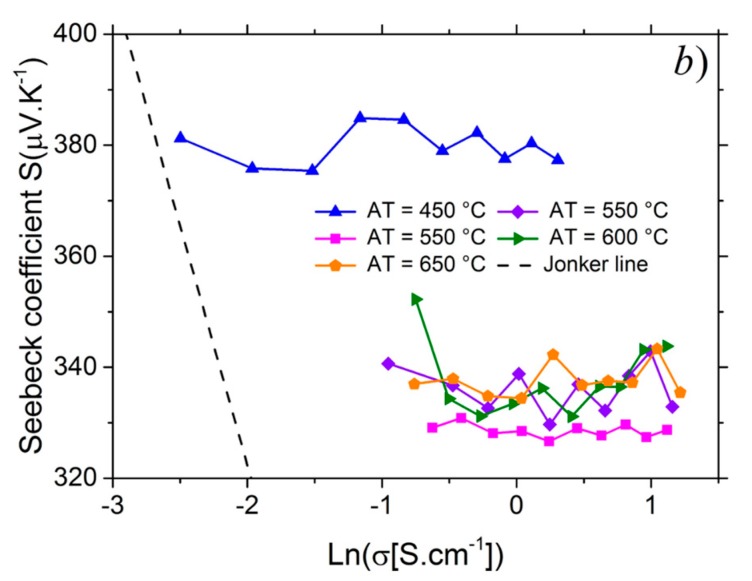
Figure 5.
(a) Seebeck coefficient, S, of the films annealed at different temperatures as a function of the measuring temperature, T. Inset: Seebeck coefficient, S, of the films at 40 °C as a function of the annealing temperature, AT; (b) Jonker plot: the relationship of the Seebeck coefficient, S, to the electrical conductivity σ for different annealing temperatures, AT.


