Figure 2.
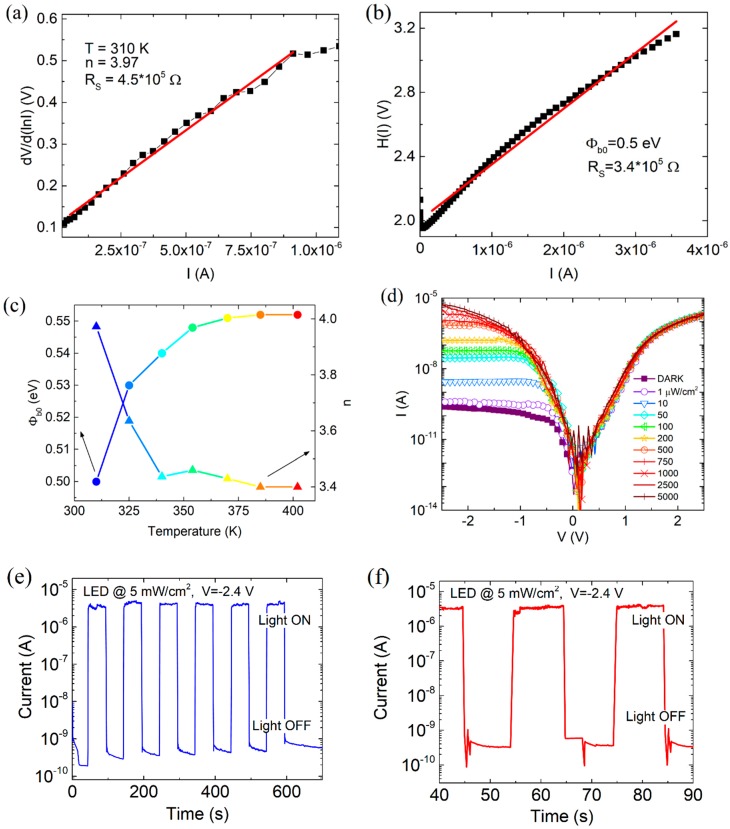
Cheung’s plot of (a) dV/dln(I) versus I and (b) H(I) vs. I. (c) Temperature dependence of ideality factor and barrier height. (d) Room-temperature I-V characteristics of the Gr/Si junction under different illumination levels from a white LED array. (e,f) Dynamic measurement of the photocurrent at reverse bias and light intensity of , showing a time response with rise and fall time of , corresponding to the time resolution of the source-measurement unit.

