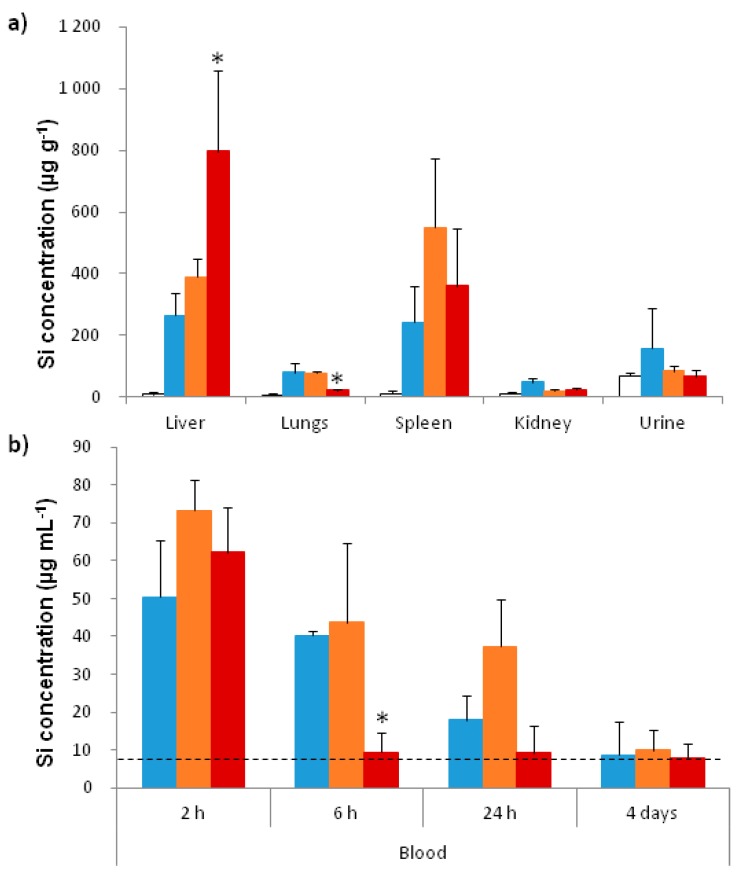
Figure 6.
Biodistribution of Fe3O4@MSN in mice. (a) Quantification of silicium in different organs 4 days after injection. Inductively coupled plasma-mass spectrometry (ICPMS) was used after acid digestion to quantify the silicium in the liver, the lungs, the spleen, the kidneys, and urine 4 days after intravenous injection of native (blue), PEG (orange) and DMPC (red) Fe3O4@MSN at a concentration of 40 mg kg−1 in comparison to control mice (white); (b) NPs level in blood. The silicium was quantified in the blood 2 h, 6 h, 24 h, and 4 days after intravenous injection of native (blue), PEG (orange) and DMPC (red) Fe3O4@MSN at a concentration of 40 mg kg−1. The dashed line indicates the silicium level found in the blood of control mice. For this experiment 20 mice were divided in 4 groups of 5 animals. Values of histograms represent mean ± SD of values of each animal of a group. * p < 0.05 statistically different from all other groups treated with NPs.

