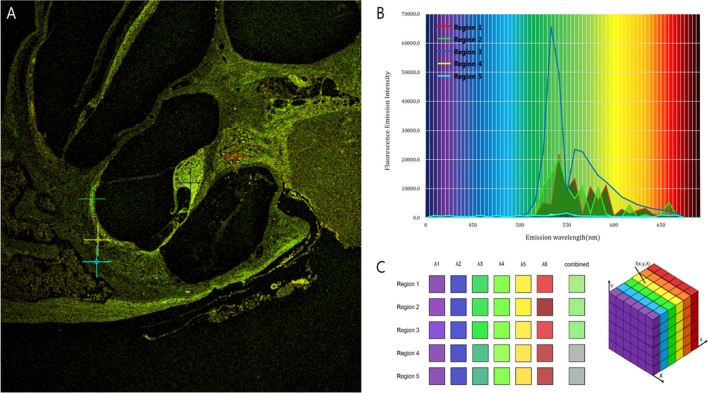
Figure 3.
Different fluorescence emission spectra of each tissue in the cochlea. (A) The peaks of intensity are different for five microstructures: Region 1 (red), spiral ganglion; region 2 (green), stria vascularis; region 3 (blue), tectorial membrane; region 4 (yellow), spiral ligament; and region 5 (sky-blue), cochlear bone. (B) Excitation spectra of the five different tissues show that irrespective of their own peaks, most wavelengths exist in the range of 530–610 nm. (C) Although the five regions have different spectra, the combined spectral image stacks of the five microstructures explain why most of the tissues in the cochlea show similar distribution of green autofluorescence.

