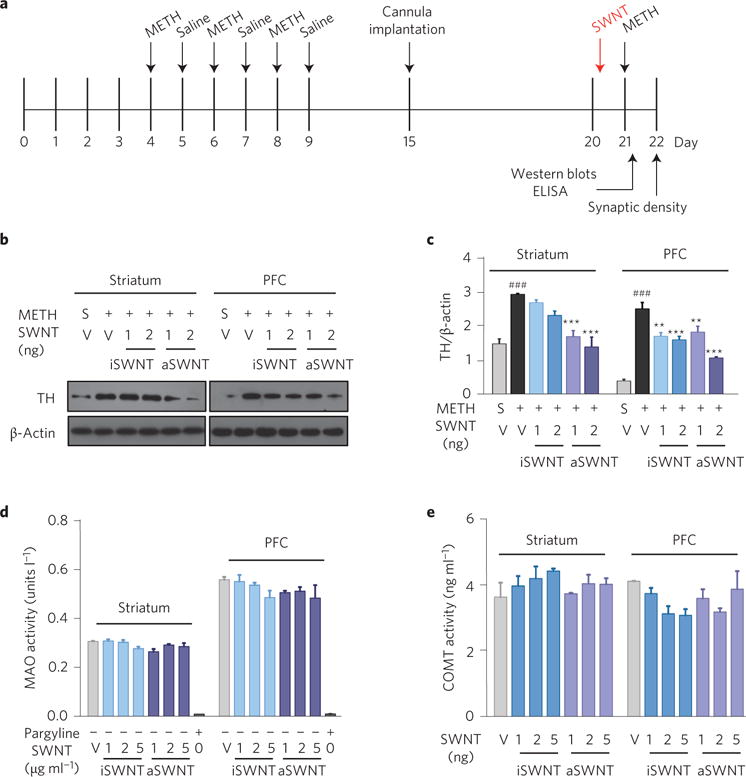
Figure 4. Effects of SWNTs and METH on the expression of tyrosine hydroxylase (TH) and the activities of dopamine degradation enzymes (MAO and COMT).

a, Timeline for the biochemical experiments. b,c, Representative (b) and quantitative (c) Western blot assay results, in which the lanes represent the TH or β-actin level in each brain tissue sample as shown above, illustrating that aSWNTs (and iSWNTs to a less extent) significantly attenuated METH-induced increases in TH expression in both the striatum (c, F5,12 = 16.59, p < 0.001) and the PFC (c, F5,12 = 34.61, p < 0.001). d,e, ELISA enzyme activity assays, illustrating that SWNT pretreatment did not alter MAO or COMT activities in either the striatum or the PFC when pre-treated with METH in mice. The error bars indicate the s.e.m. of the mean values from 4 brain samples (from 4 mice) in each group. Each brain sample was replicated three times. ###p < 0.001, compared with the vehicle+saline group (grey bar). **p < 0.01, ***p < 0.001, compared with the vehicle+METH group (black bar). S, saline; V, vehicle.
