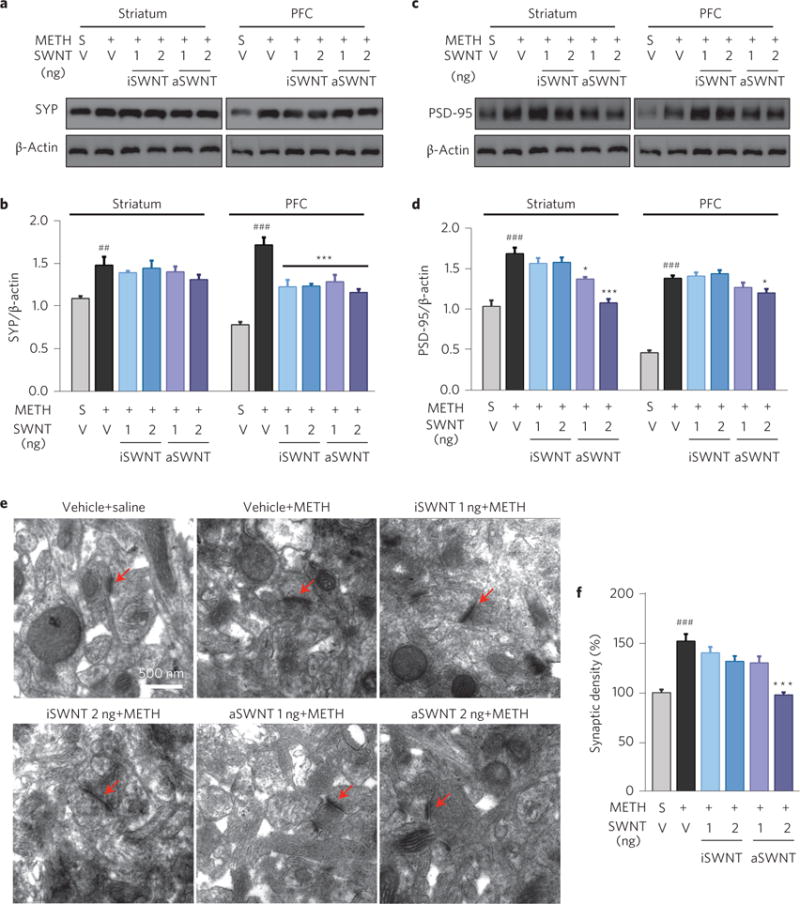
Figure 5. Effects of METH and SWNTs on synaptic marker proteins and synaptic density in the striatum.

a–d, Representative (a,c) and quantitative (b,d) Western immunoblot assays, illustrating that repeated METH treatment significantly increased the expression of SYP (a,b) and PSD-95 (c,d) in both the striatum and PFC (n = 3 mice per group). This increase was dose-dependently attenuated by SWNT pretreatment (b, striatum: F5,12 = 22.53, p < 0.001; PFC: F5,12 = 4.66, p < 0.05; d, striatum: F5,12 = 28.05, p < 0.001; PFC: F5,12 = 21.20, p < 0.001). e, Representative transmission electron microscope (TEM) images of synapses (marked by red arrows) in the striatum in the different treatment groups. f, Quantitative results of the synaptic density, illustrating that aSWNT pretreatment attenuated repeated METH-induced increases in synaptic density (F5,114 = 16.57, p < 0.001). The error bars indicate the s.e.m. of the mean values from 3 brain samples (from 3 animals) in each group. Each brain sample was replicated three times in Western blot assays (b,d). ##p < 0.01, ###p < 0.001, compared with the vehicle+saline group (grey bar). *p < 0.05, ***p < 0.001, compared with the vehicle+METH group (black bar).
