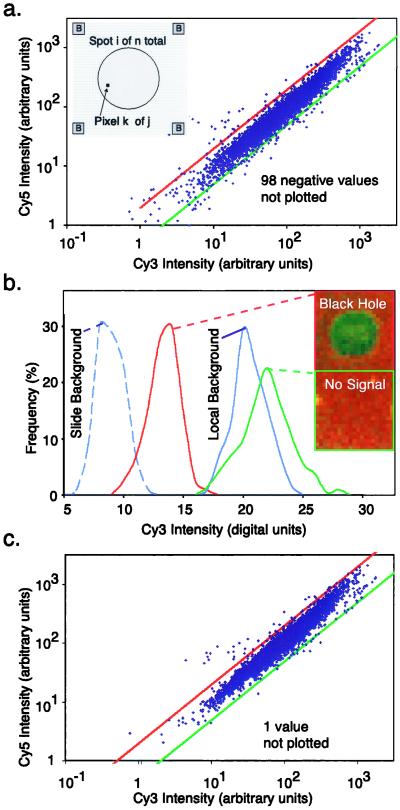
Figure 1.
Comparing local and best-fit methods for determining array background. (a) Gene expression graph of Cy5 vs. Cy3 intensity for 6,200 yeast genes with local background used to offset signal intensities. Not shown are 98 spots with negative intensities. (Inset) Local background was determined by averaging red and green intensities over 16 pixels, at each of the four corners (marked B) of a rectangular region surrounding each spot. (b) Distribution of Cy5 intensities for a region of the slide away from the hybridization area (dotted blue line), a spot with negative intensity (a “black hole,” red line), local background surrounding the black hole (solid blue line), and a nearby low-intensity spot (green line). Each distribution is derived from over 150 sampled pixels. (c) Gene expression graph as in b, but with best-fit background. Only one (obviously scratched) spot has negative intensity and is not shown.

