
Figure 4.
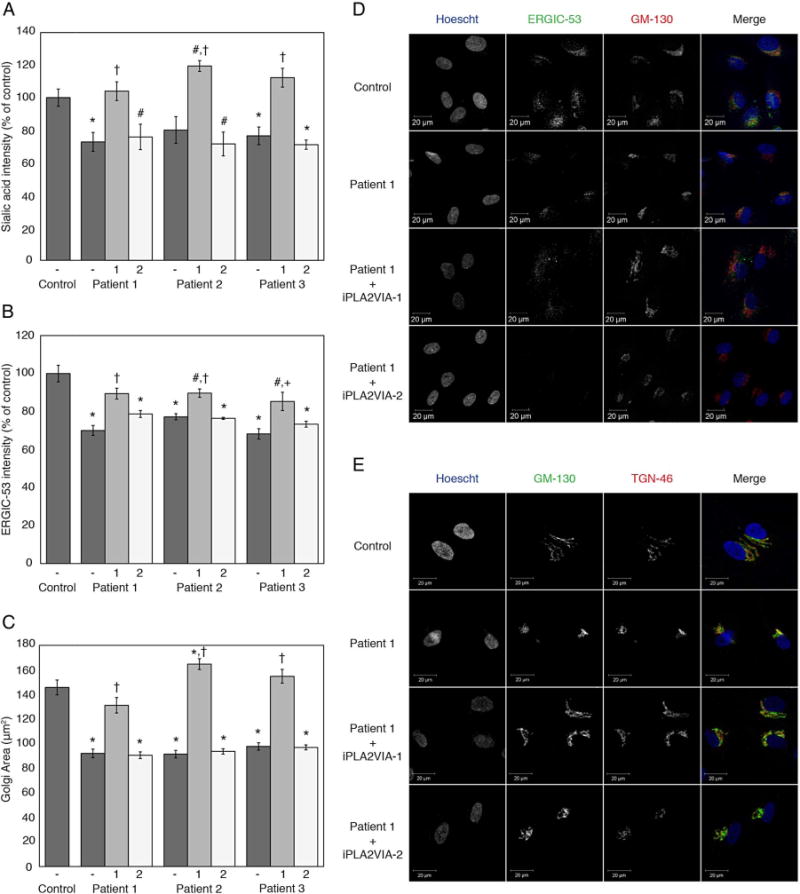
Quantification of ER-Golgi intermediate compartment (ERGIC) and Golgi area by immunofluorescence and quantification of terminal sialic acid and terminal GlcNAc by lectin staining. (A) Graph of relative fluorescent intensity for Maackia amurensis lectin II (MAL II) and Sambucus nigra (elderberry) bark lectin (SNA) staining of terminal sialic acid. Data from the patient fibroblasts without (−) or with overexpression of iPLA2VIA-1 (1) or iPLA2VIA-2 (2) are plotted relative to that of control fibroblasts. Also see online supplementary figure S-2 and S-3. (B) Graph showing relative ERGIC-53 fluorescent intensity. Data from the patient fibroblasts without (−) or with overexpression of iPLA2VIA-1 (1) or iPLA2VIA-2 (2) are plotted relative to that of control fibroblasts. (C) Graph representing 2D-Golgi area of control fibroblasts and patient fibroblasts without (−) or with overexpression of iPLA2VIA-1 (1) or iPLA2VIA-2 (2). Golgi area was assessed by immunofluorescence staining with anti-GM-130 and anti-TGN-46. (D) Representative immunofluorescence images for ERGIC staining in Control and Patient 1 fibroblasts, with and without overexpression of iPLA2VIA-1 or iPLA2VIA-2. (E) Representative immunofluorescence images for staining of cis-Golgi with GM-130 and trans-Golgi with TGN-46 in Control and Patient 1 fibroblasts, with and without overexpression of iPLA2VIA-1 or iPLA2VIA-2. #p<0.05 versus control fibroblasts, *p<0.005 versus control fibroblasts, +p<0.01 versus fibroblasts from the same patient without overexpression of PLA2G6, and †p<0.005 versus fibroblasts from the same patient without overexpression of PLA2G6. Error bars represent SEM.