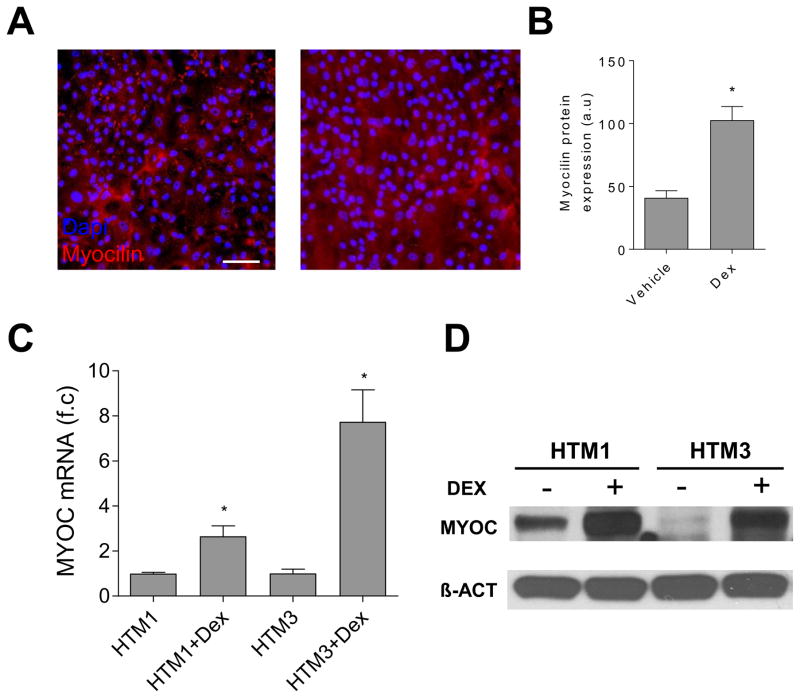
Figure 1.
TM cell characterization. Representative immunofluorescence images (A) and the summary of the immunofluorescence study (B) showed that the myocilin level in the HTM2 cells was increased after Dex treatment (100 nM) for seven days. (C) The myocilin mRNA levels elevated in both the HTM1 cells and the HTM3 cells after Dex (100 nM) treatment for five days. Each experiment was carried out at two independent times; each measurement was done in triplicate. (D) The Western Blot studies showed that the myocilin protein levels increased in both HTM1 and HTM3 after Dex treatment for five days.

