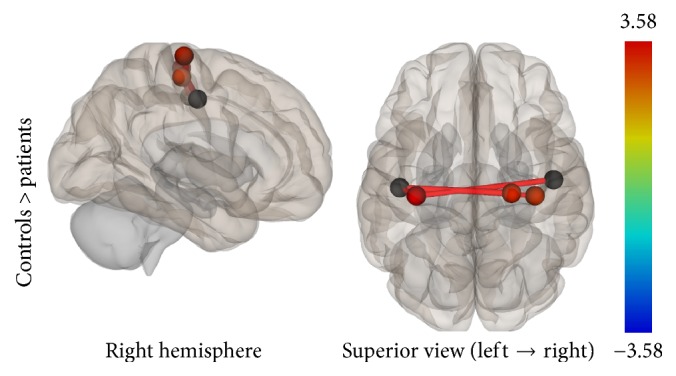
Figure 11.

ROI-to-ROI analysis. Statistically significant lower functional connectivity in the patients compared to controls for the SMN (p-FDR < 0.05). Line thickness corresponds to the actual p value of the difference between the two groups. The color of the balls denoting the ROIs signifies the p value of the difference between the two groups according to the colorbar.
