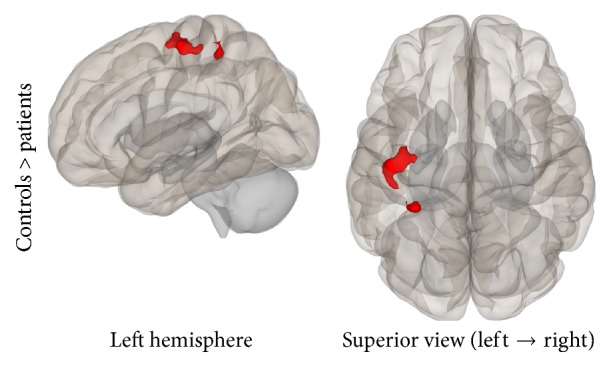
Figure 12.

Seed-to-Voxel analysis. Statistically significant lower functional connectivity in the patients compared to controls for the SMN (voxel p-unc < 0.01; cluster p-FDR < 0.05). Red color indicates cluster with decreased functional connectivity for the patients.
