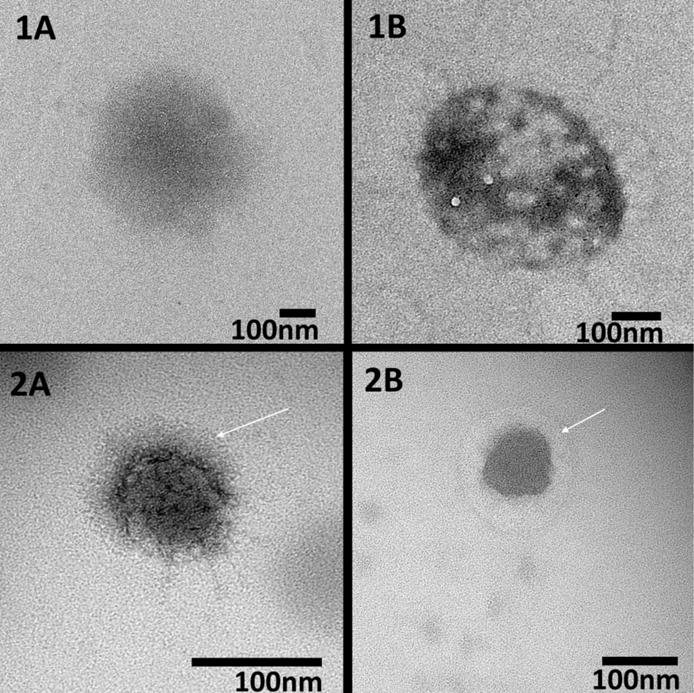
Figure 2.

TEM images of non-PEGylated (1A, 1B) and PEGylated (2A, 2B) solid (1A, 2A) and hollow (1B, 2B) nanoparticles demonstrating decreased density in the hollow particles as well as halos around PEGylated particles (white arrows). Particles were stained with uranyl acetate prior to imaging. Scale bar = 100 nm
