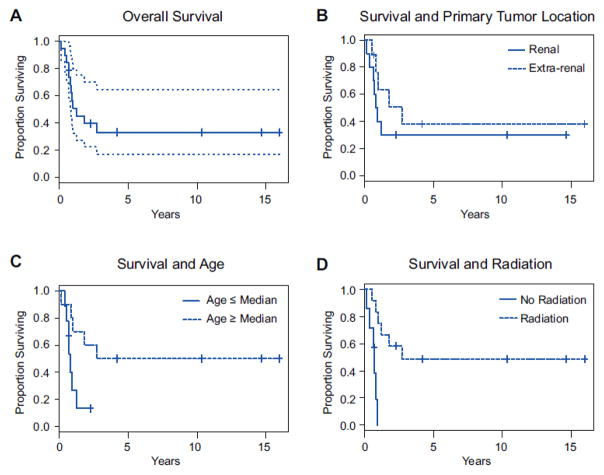
Figure 1. Kaplan-Meier Survival Analyses.
(A) Overall survival for the entire cohort. Dotted lines show the 95% confidence interval. (B) Survival stratified by the presence of a renal or extrarenal primary tumor at presentation (P=0.321). (C) Survival stratified by age above or below the median age of 1.5 years (P=0.049). (D) Survival of patients treated with and without adjuvant radiation therapy (P=0.002).

