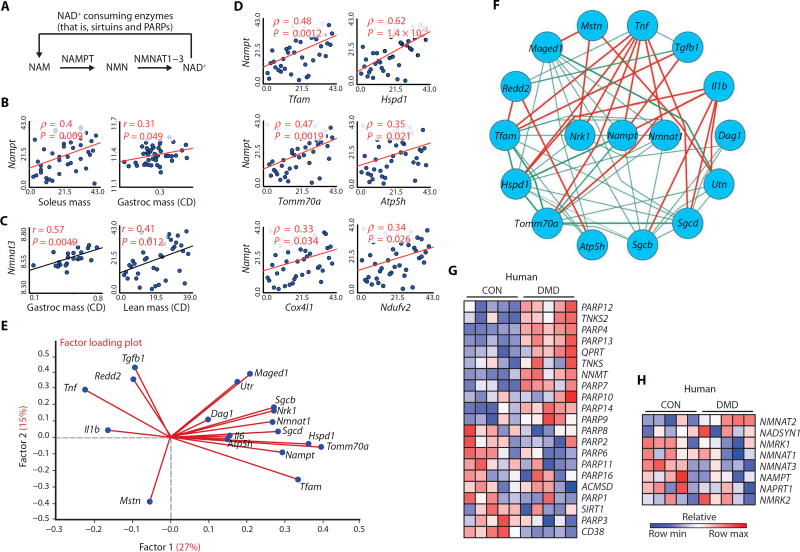
Fig. 1. The relationship between transcripts involved in NAD+ biosynthesis and consumption with muscular dystrophy in mice and DMD patients.
(A) Schematic illustrating NAD+ consumption by sirtuins and PARPs and the salvage of NAD+ from NAM via NAMPT and NMNAT enzymes. (B and C) Correlation of Nampt (B) and Nmnat3 (C) transcripts from 42 strains of genetically diverse BXD mice with various measurements of muscle mass, as a percentage of body weight. CD, chow diet. (D) Correlation of Nampt transcript expression in the BXD strains with transcript expression for regulators of mitochondrial transcription and for genes encoding the components of the mitochondria. (E) A factor loading plot (biplot) showing the correlation of transcripts for mitochondrial-related genes (Tfam, Hspd1, Atp5h, and Tomm70a), utrophin (Utr), dystrophin-associated glycoproteins (Dag1, Sgcb, and Sgcd), muscle growth–related genes (Maged1 and Il6), and genes involved in the pathology of mdx mice (Tgfb1, Tnf, Mstn, Il1b, and Redd2) with NAD+ synthesis transcripts (Nampt, Nmnat1, and Nrk1) in the BXD mouse strains. Angles more than 90° between gene vectors represent negative correlation (an angle of 180° indicates perfect negative correlation). (F) These transcripts were then plotted in a circular schematic using Pearson’s r ≥ |0.2| in BXD strains showing negative (red) and positive (green) correlations. The expression of transcripts related to NAD+ (G) consumption or (H) biosynthesis shows an enrichment signature of PARP genes and of the NNMT gene in human DMD skeletal muscle data sets (n = 5 per group) (24, 25). CON, control.

