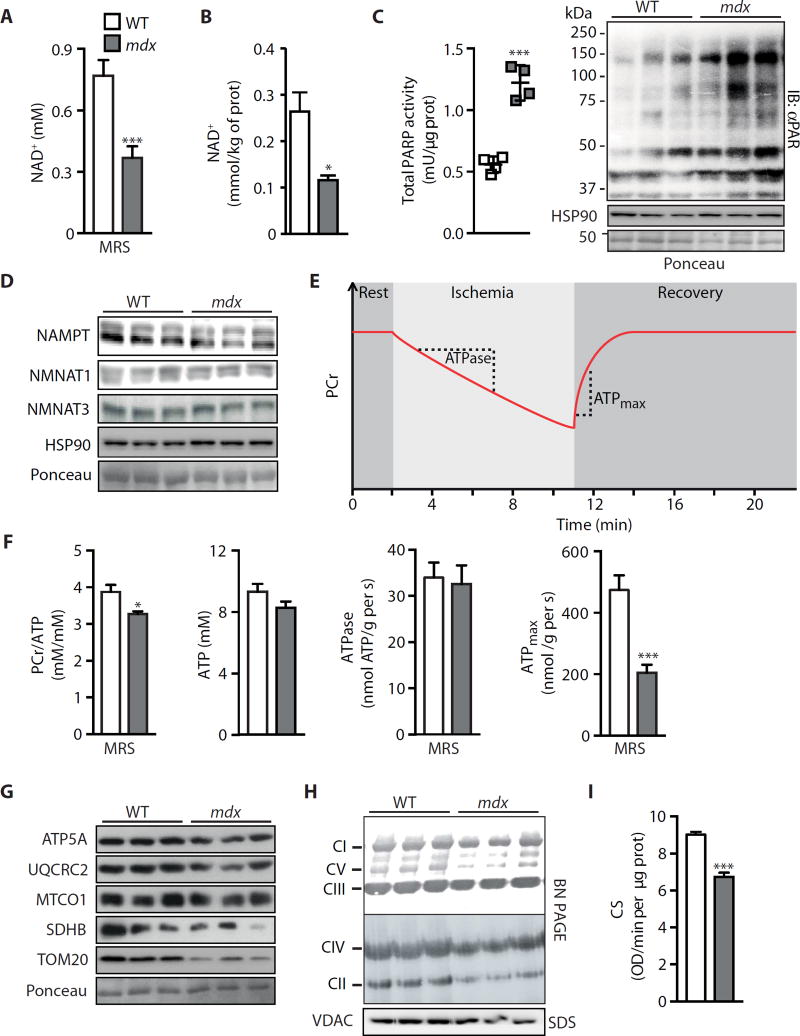
Fig. 2. NAD+ as a marker and limiting factor for in vivo energetics and mitochondrial function in mdx mice.
Measurements on gastrocnemius from 16-week-old male mdx or control mice. As a new marker for muscular dystrophy, (A) NAD+ levels were reduced, as measured by 31P MRS [wild type (WT), n = 7; mdx, n = 12]. (B) These values paralleled total intracellular NAD+ levels measured by mass spectrometry in tissue extracts (n = 5). Reductions in NAD+ levels may be due to augmented NAD+ consumption, evidenced by enhanced (C) PARP activity (n = 4) and total PARylation content (WT, 1.00 ± 0.25; mdx, 2.19 ± 0.31; P = 0.042), in addition to reduced NAD+ salvage demonstrated by lower (D) NAMPT protein (WT, 1.00 ± 0.03; mdx, 0.69 ± 0.09; P = 0.036), with NMNAT1 (WT, 1.00 ± 0.09; mdx, 0.88 ± 0.03) and NMNAT3 (WT, 1.00 ± 0.05; mdx, 0.89±0.01; P = 0.009) unchanged, using heat shock protein 90 (HSP90) or Ponceau staining as loading controls. prot, protein; IB, immunoblot. (E) Schematic of in vivo 31P MRS of mdx skeletal muscle mitochondrial energetics. Dynamic magnetic resonance (MR) spectra were acquired during the following periods: rest (2 min), ischemia (9 min), and recovery (9 min). (F) High-performance liquid chromatography (HPLC) and 31P MRS measurements of ATP and PCr, respectively, showing unchanged ATP levels (n = 7) and a reduction in the PCr/ATP ratio (WT, n = 7; mdx, n = 5). Because the resting ATPase activity did not change (indicating unaltered ATP demand) (WT, n = 7; mdx, n = 5), mdx animals must function at an increased fraction of their now reduced maximal capacity (ATPmax) (WT, n = 7; mdx, n = 5) to meet the unchanged ATP demand, when MRS data are compared to control animals. mdx muscle exhibited corresponding reductions in mitochondrial proteins and function in mdx muscle, as represented by (G) ATP5A (WT, 1.00 ± 0.06; mdx, 0.51 ± 0.04; P = 0.002), UQCRC2 (WT, 1.00 ± 0.06; mdx, 0.36 ± 0.09; P = 0.004), MTCO1 (WT, 1.00 ± 0.20; mdx, 0.59 ± 0.04), SDHB (WT, 1.00 ± 0.27; mdx, 0.36 ± 0.16), and TOM20 (WT, 1.00 ± 0.07; mdx, 0.35 ± 0.12; P = 0.012) compared to HSP90 (D) as loading control, (H) blue native polyacrylamide gel electrophoresis (BN PAGE) of isolated mitochondria, and (I) CS activity (n = 9). VDAC, voltage-dependent anion channel; OD, optical density.

