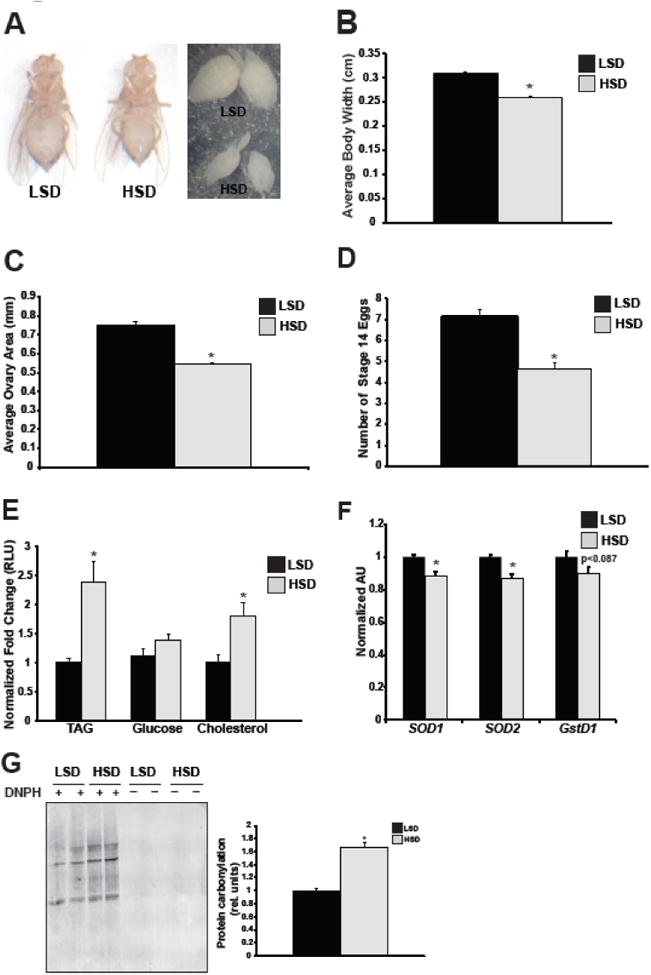
Fig. 2. HSD depletes mature egg production and elevates TAG and cholesterol levels in the ovary.

Representative images of LSD and HSD adult females and ovaries are shown after 7 days on diet taken at 10X magnification (A), along with corresponding quantification of average body width (B), ovary area (C), number of stage 14 eggs present in ovaries (D), and ovarian TAG, cholesterol, and glucose levels (E). Body measurements are n=5 flies; ovary area n=83-93 ovaries; stage 14 eggs n=40 ovaries. TAG, cholesterol, and glucose levels were quantified from isolated ovaries of adult females, n=9-14 pooled samples. qPCR measurement of mRNA expression levels of SOD1 (superoxide dismutase 1), SOD2 (superoxide dismutase 2), and gstD1 (glutathione S-transferase D1) from ovaries. n=8 pooled samples (F). Protein carbonylation of ovary whole-cell lysates treated with (+) or without (-) DNPH were visualized by Western blot using Odyssey imaging software. Representative blot is shown (left) as well as quantification (right). n=3 pooled samples (G). All data is expressed as mean ± SEM, *p<0.05.
